ORDER FLOW TRADING
All The Order Flow Features You Need
-- In One Platform
Extensive and customizable Order Flow tools make it easy for you to analyze trading activity using volume, order flow and depth of market.
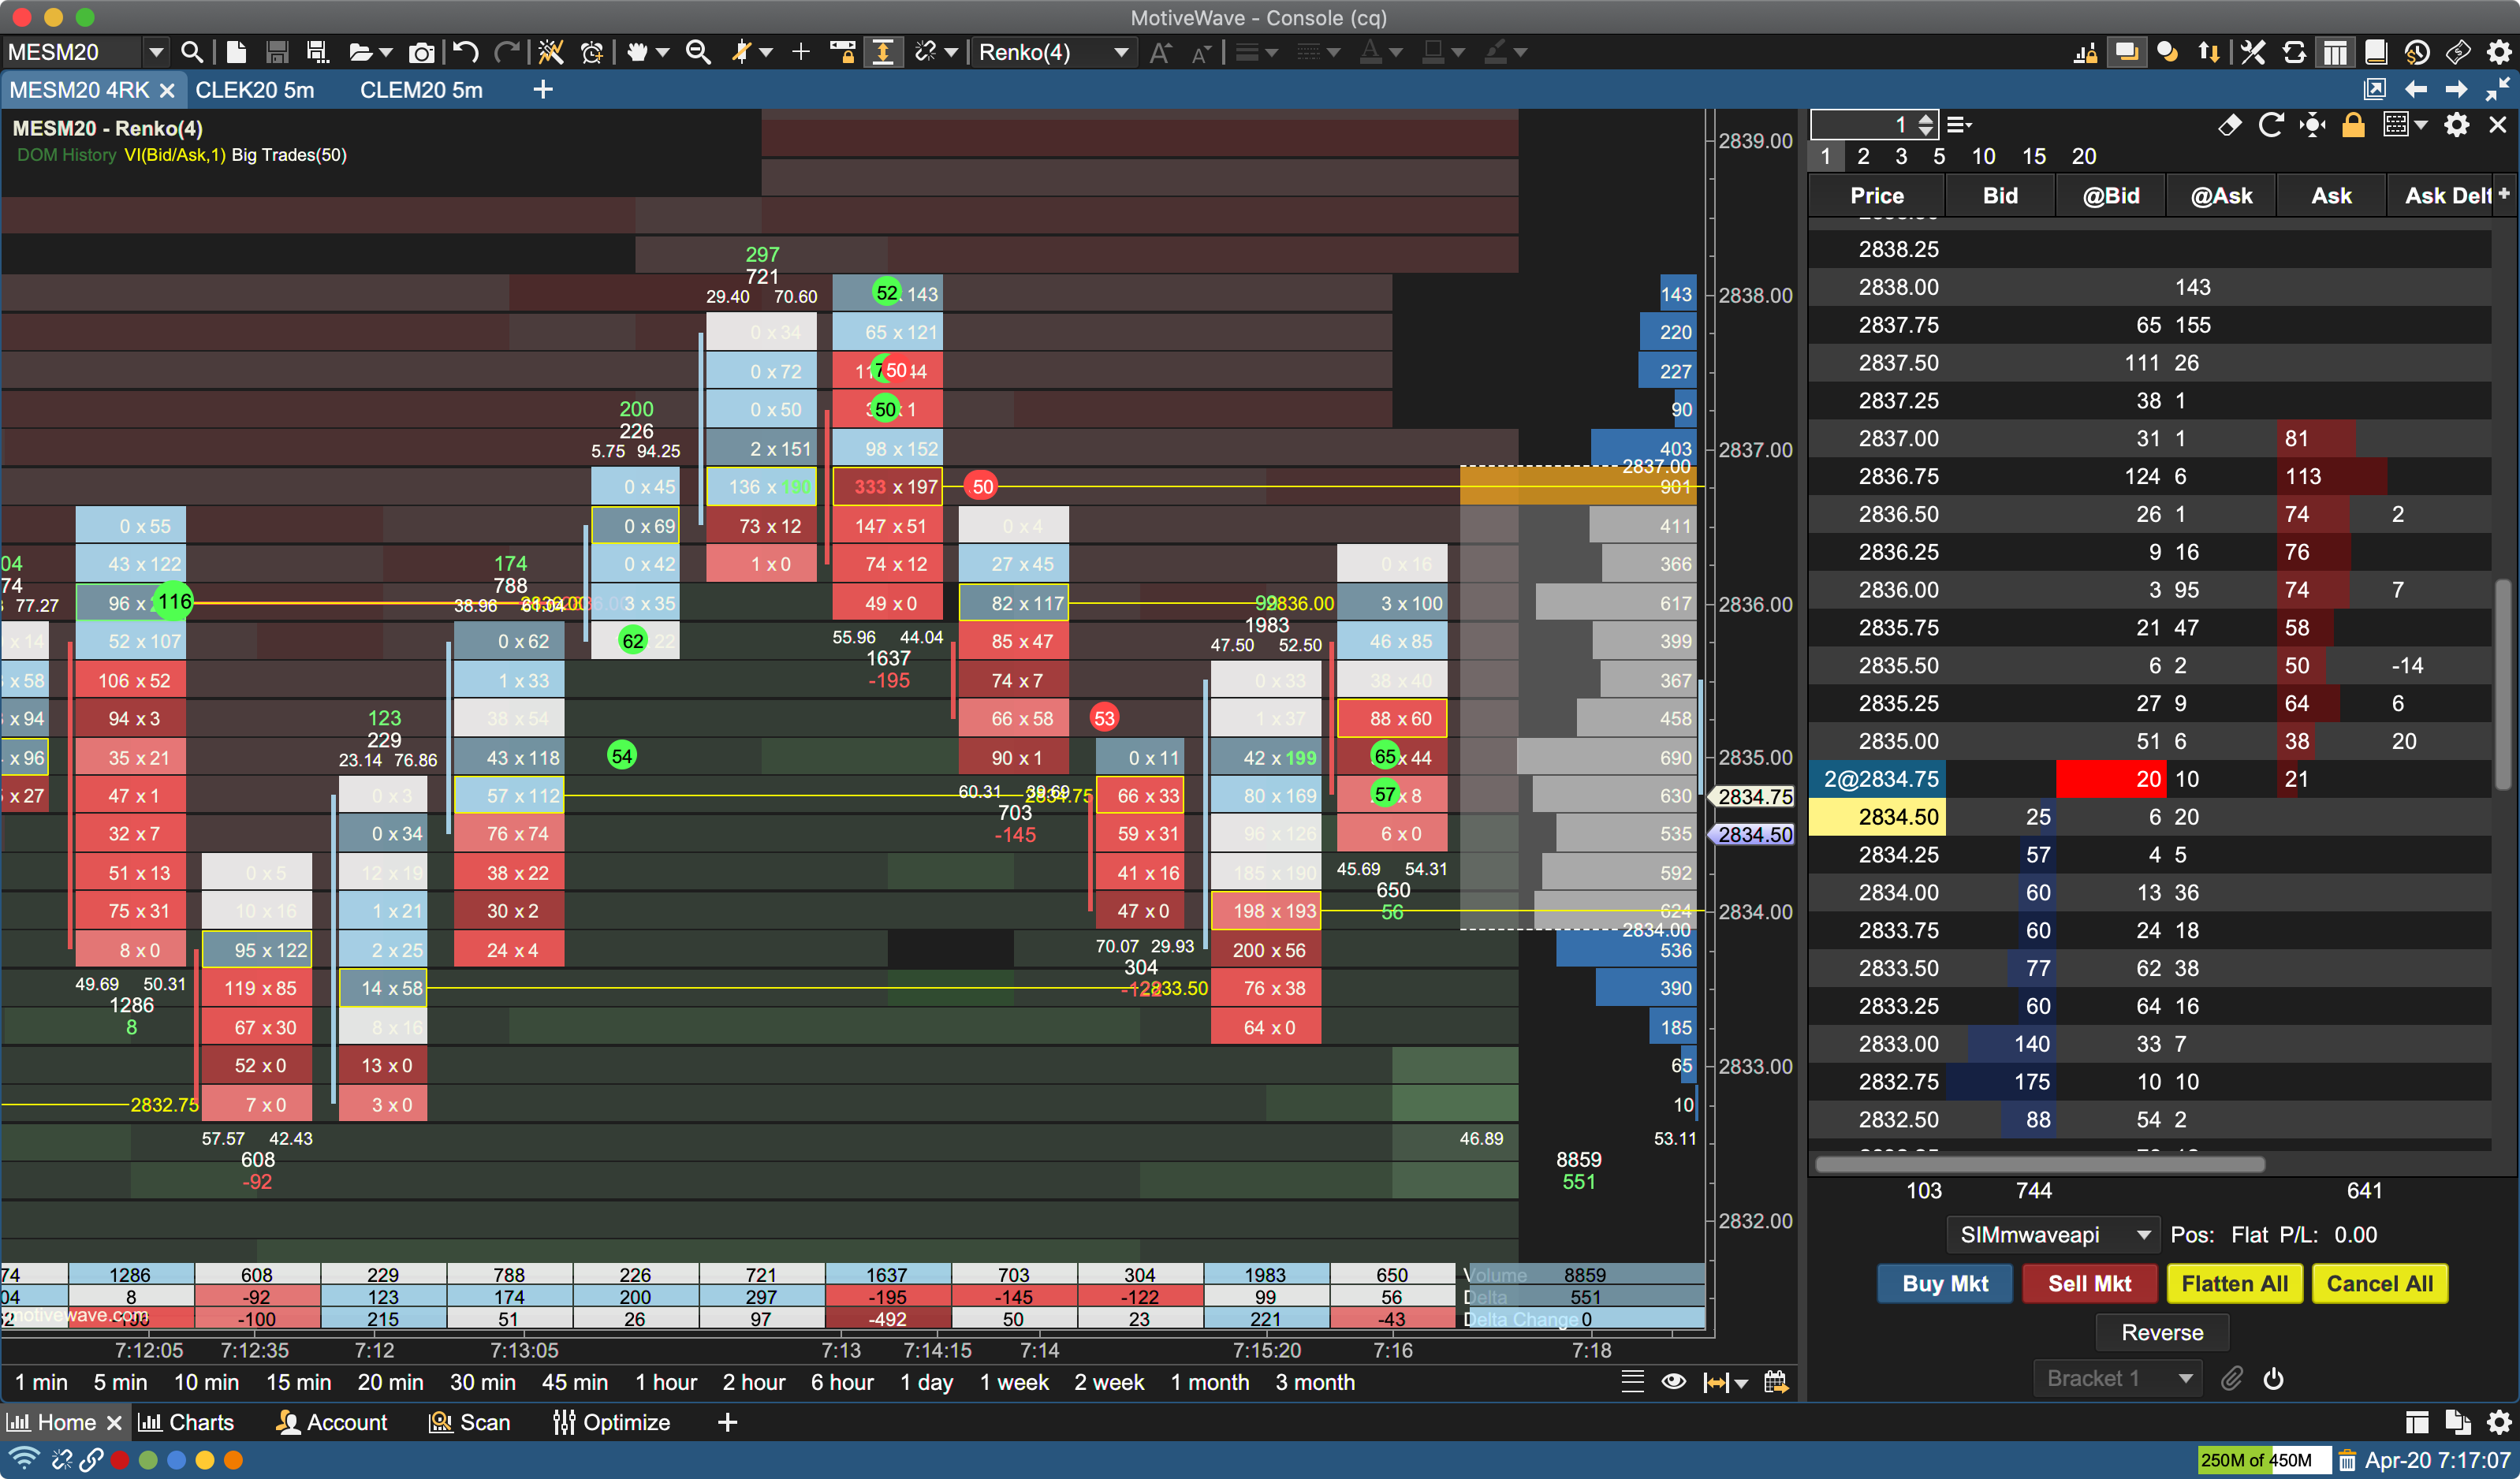
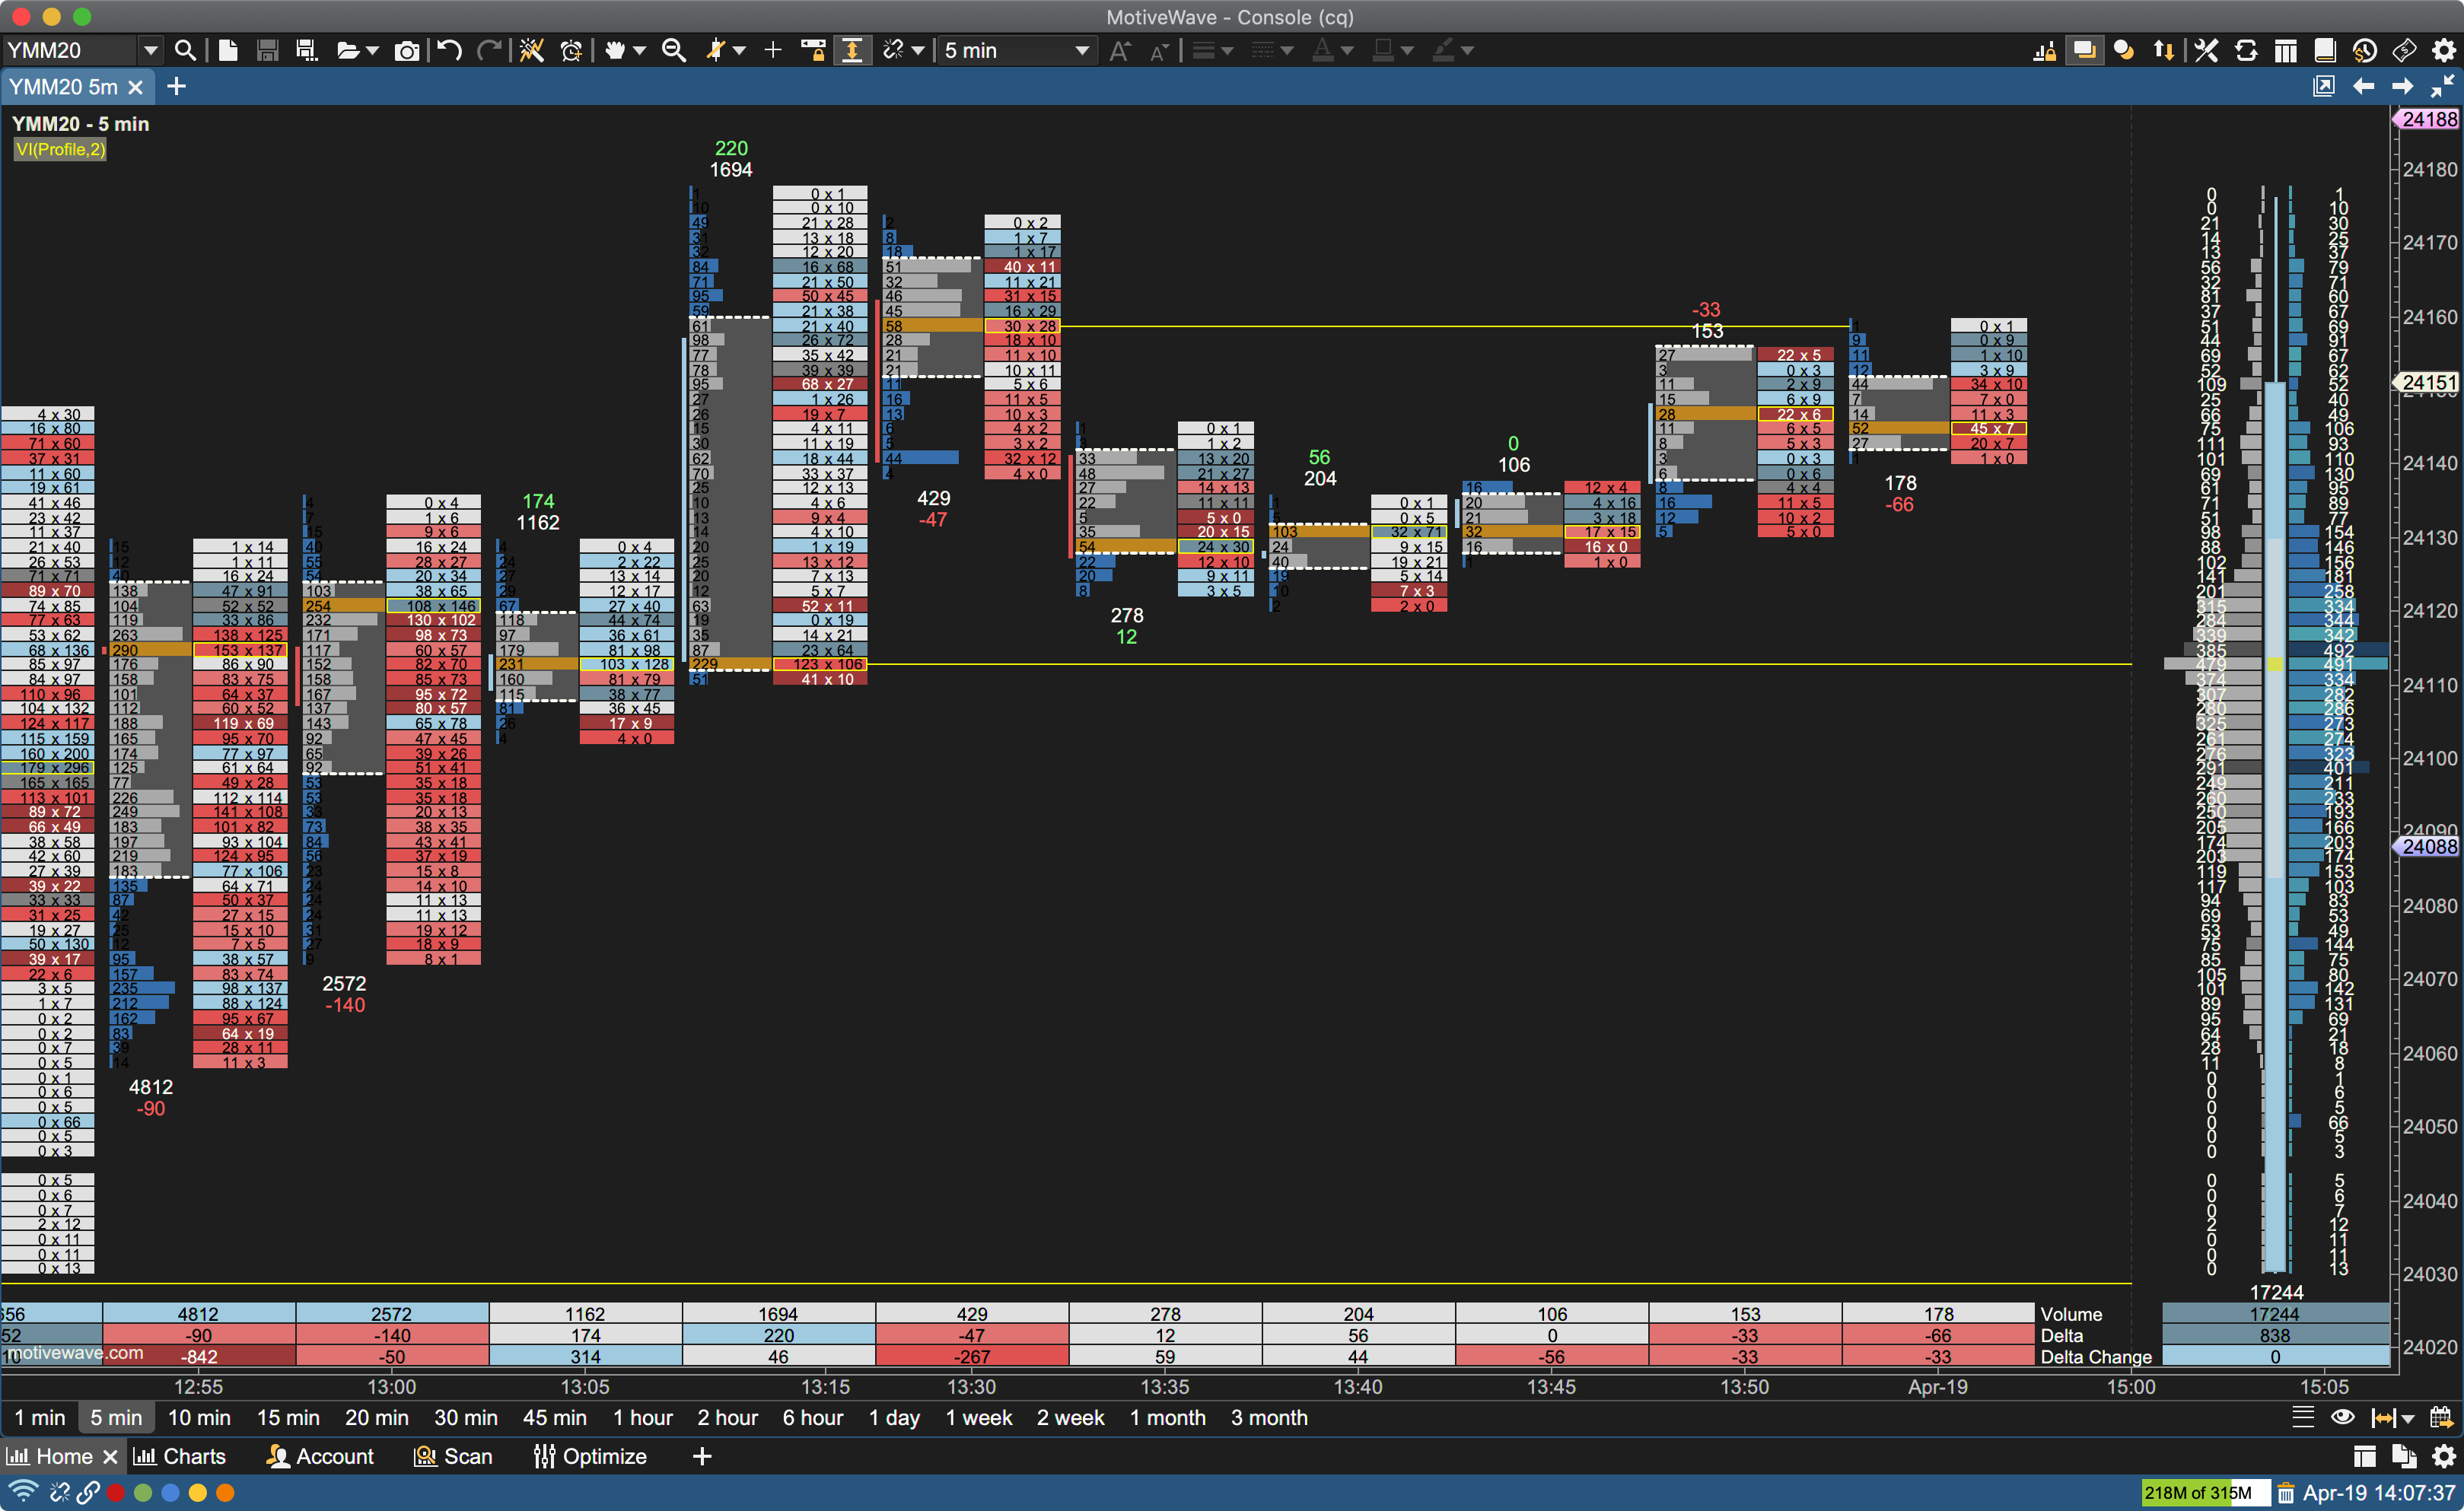
Volume Imprint (Footprint Charts)
Volume Imprint provides several ways to look at volume and how it relates to price. This study uses historical tick data to segment volume into price intervals. Each price interval divides the volume into bid volume and ask volume.
There are currently 5 different types of display candles:
- Profile
- Bid/Ask
- Ladder
- Delta
- Volume
A summary profile can also be displayed that summarizes the volume that occurred over the given time span (visible bars, day, week or month). This summary can be displayed as a volume profile or ladder.
The Volume Imprint Study is included in our Order Flow Studies Pack (shown below).
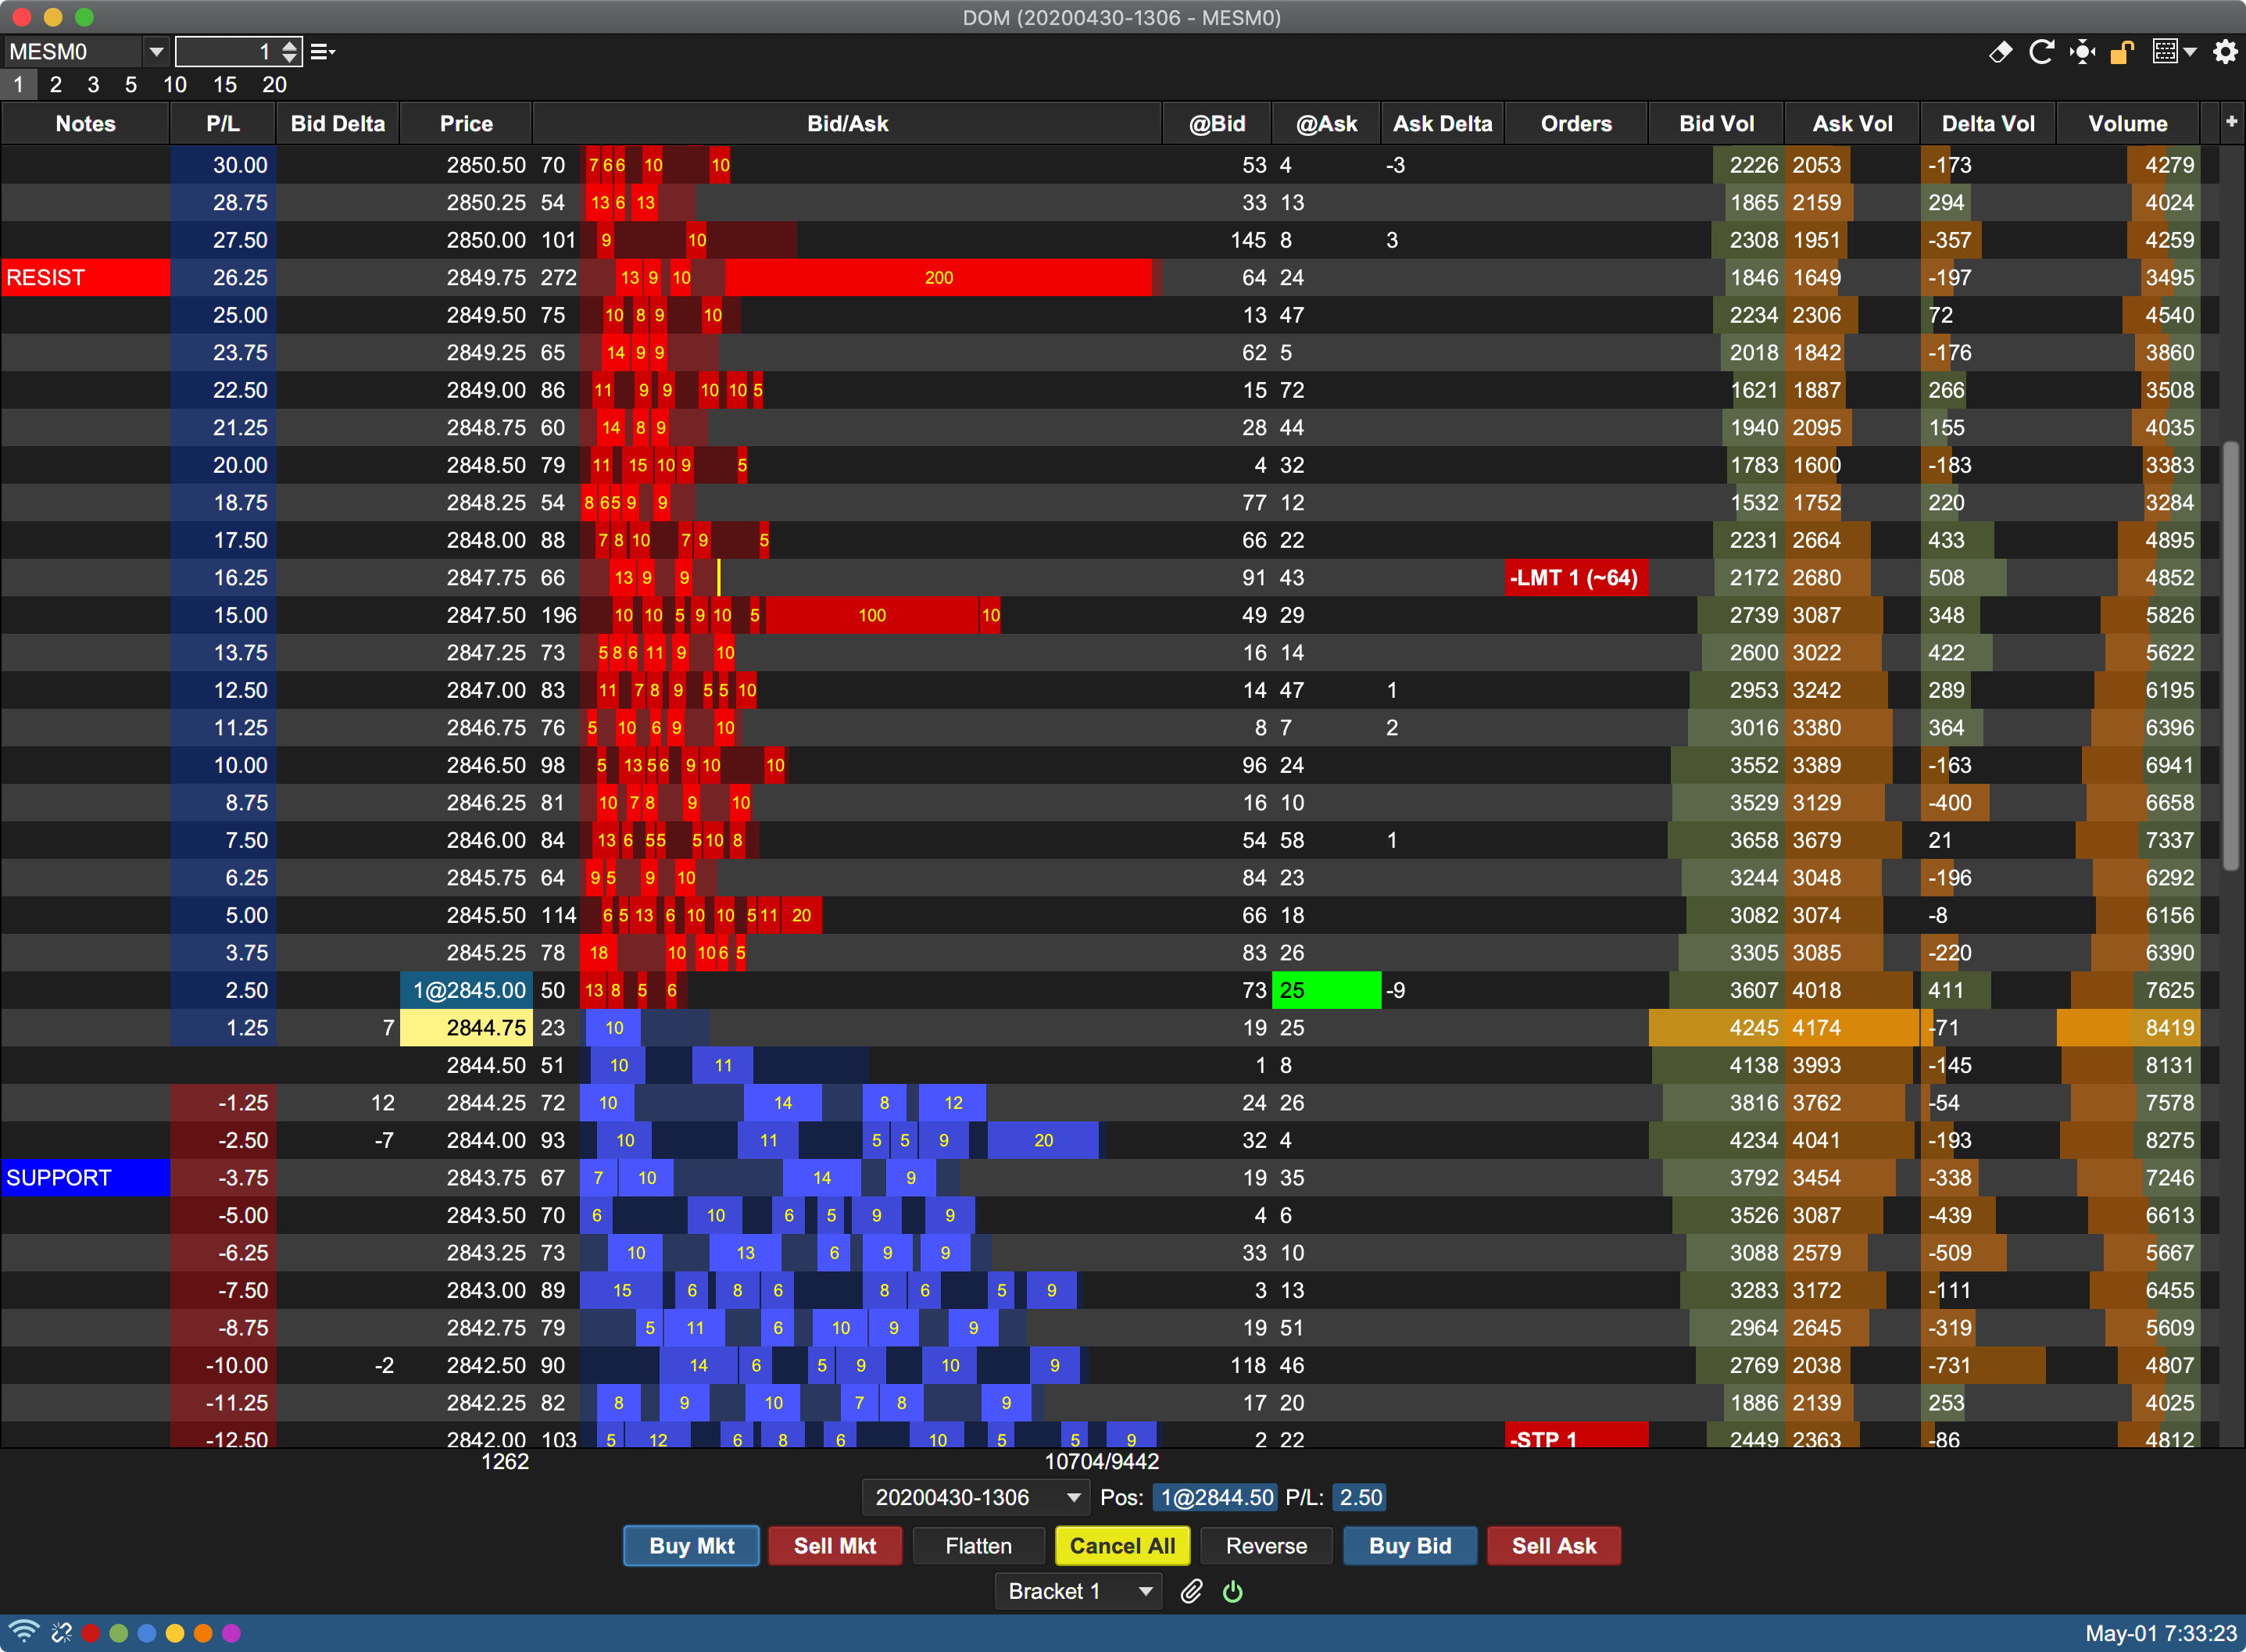
Depth of Market (DOM)
- Highly customizable DOM to match your preferences
- Add/Remove Depth of Market (DOM) Columns
- Market by Order displays individual order sizes in the Bid/Ask Columns (Rithmic Only)
- Set custom Exit Strategies
- Create DOM Templates
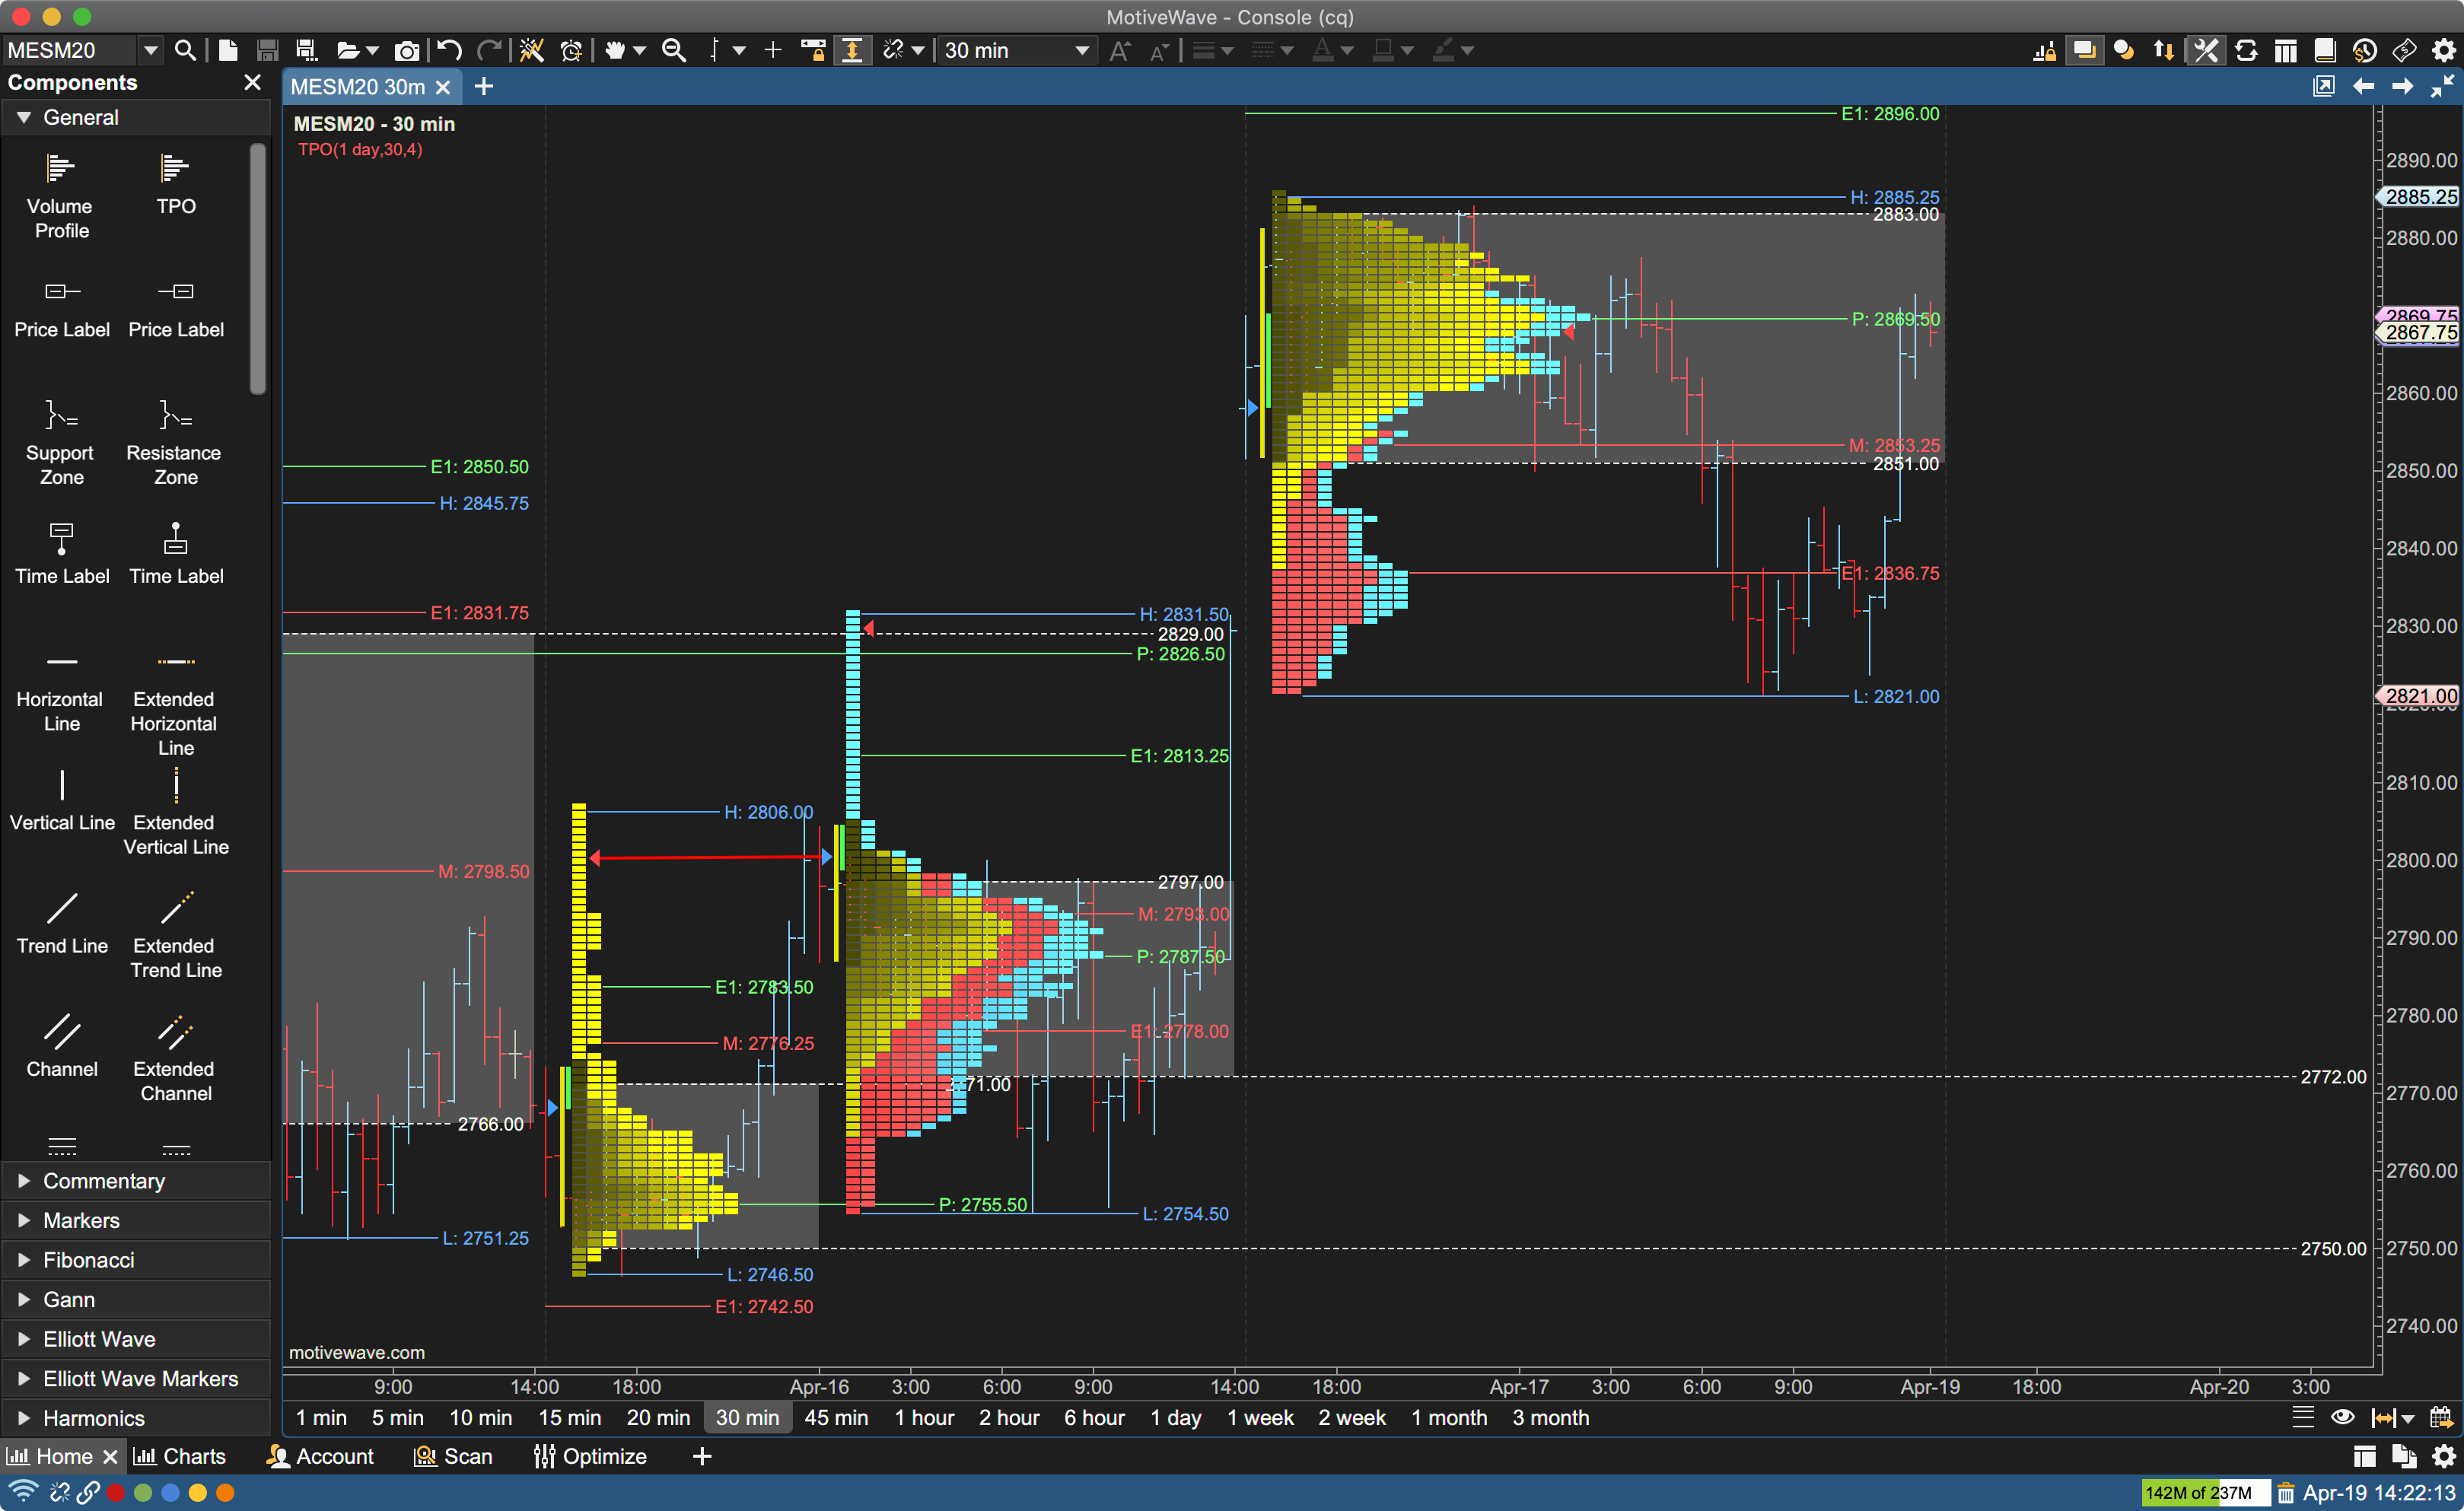
Time Price Opportunity (TPO) Study & Component
The Time Price Opportunity (TPO) Study displays market activity using time and price (sometimes known as Market Profile). It plots the difference between the Bid/Ask Volume as it accumulates throughout the trading day.
- Highly customizable settings to match your preferences
- Display TPO Point of Control, Value Area
- Split/Merge TPO Profiles
- Shows key support and resistance price levels.
An additional Time Price Opportunity (TPO) Component offers a convenient way to drag/drop a TPO onto a chart and dynamically adjust the range using the resize points. It displays a histogram that represents the amount of time spent at each price range. The TPO Component is effectively the same as the TPO Study, except that only one TPO is displayed and you can configure the data range by moving the resize points.
The Time Price Opportunity (TPO) Study is included in our Order Flow Studies Pack (shown below).
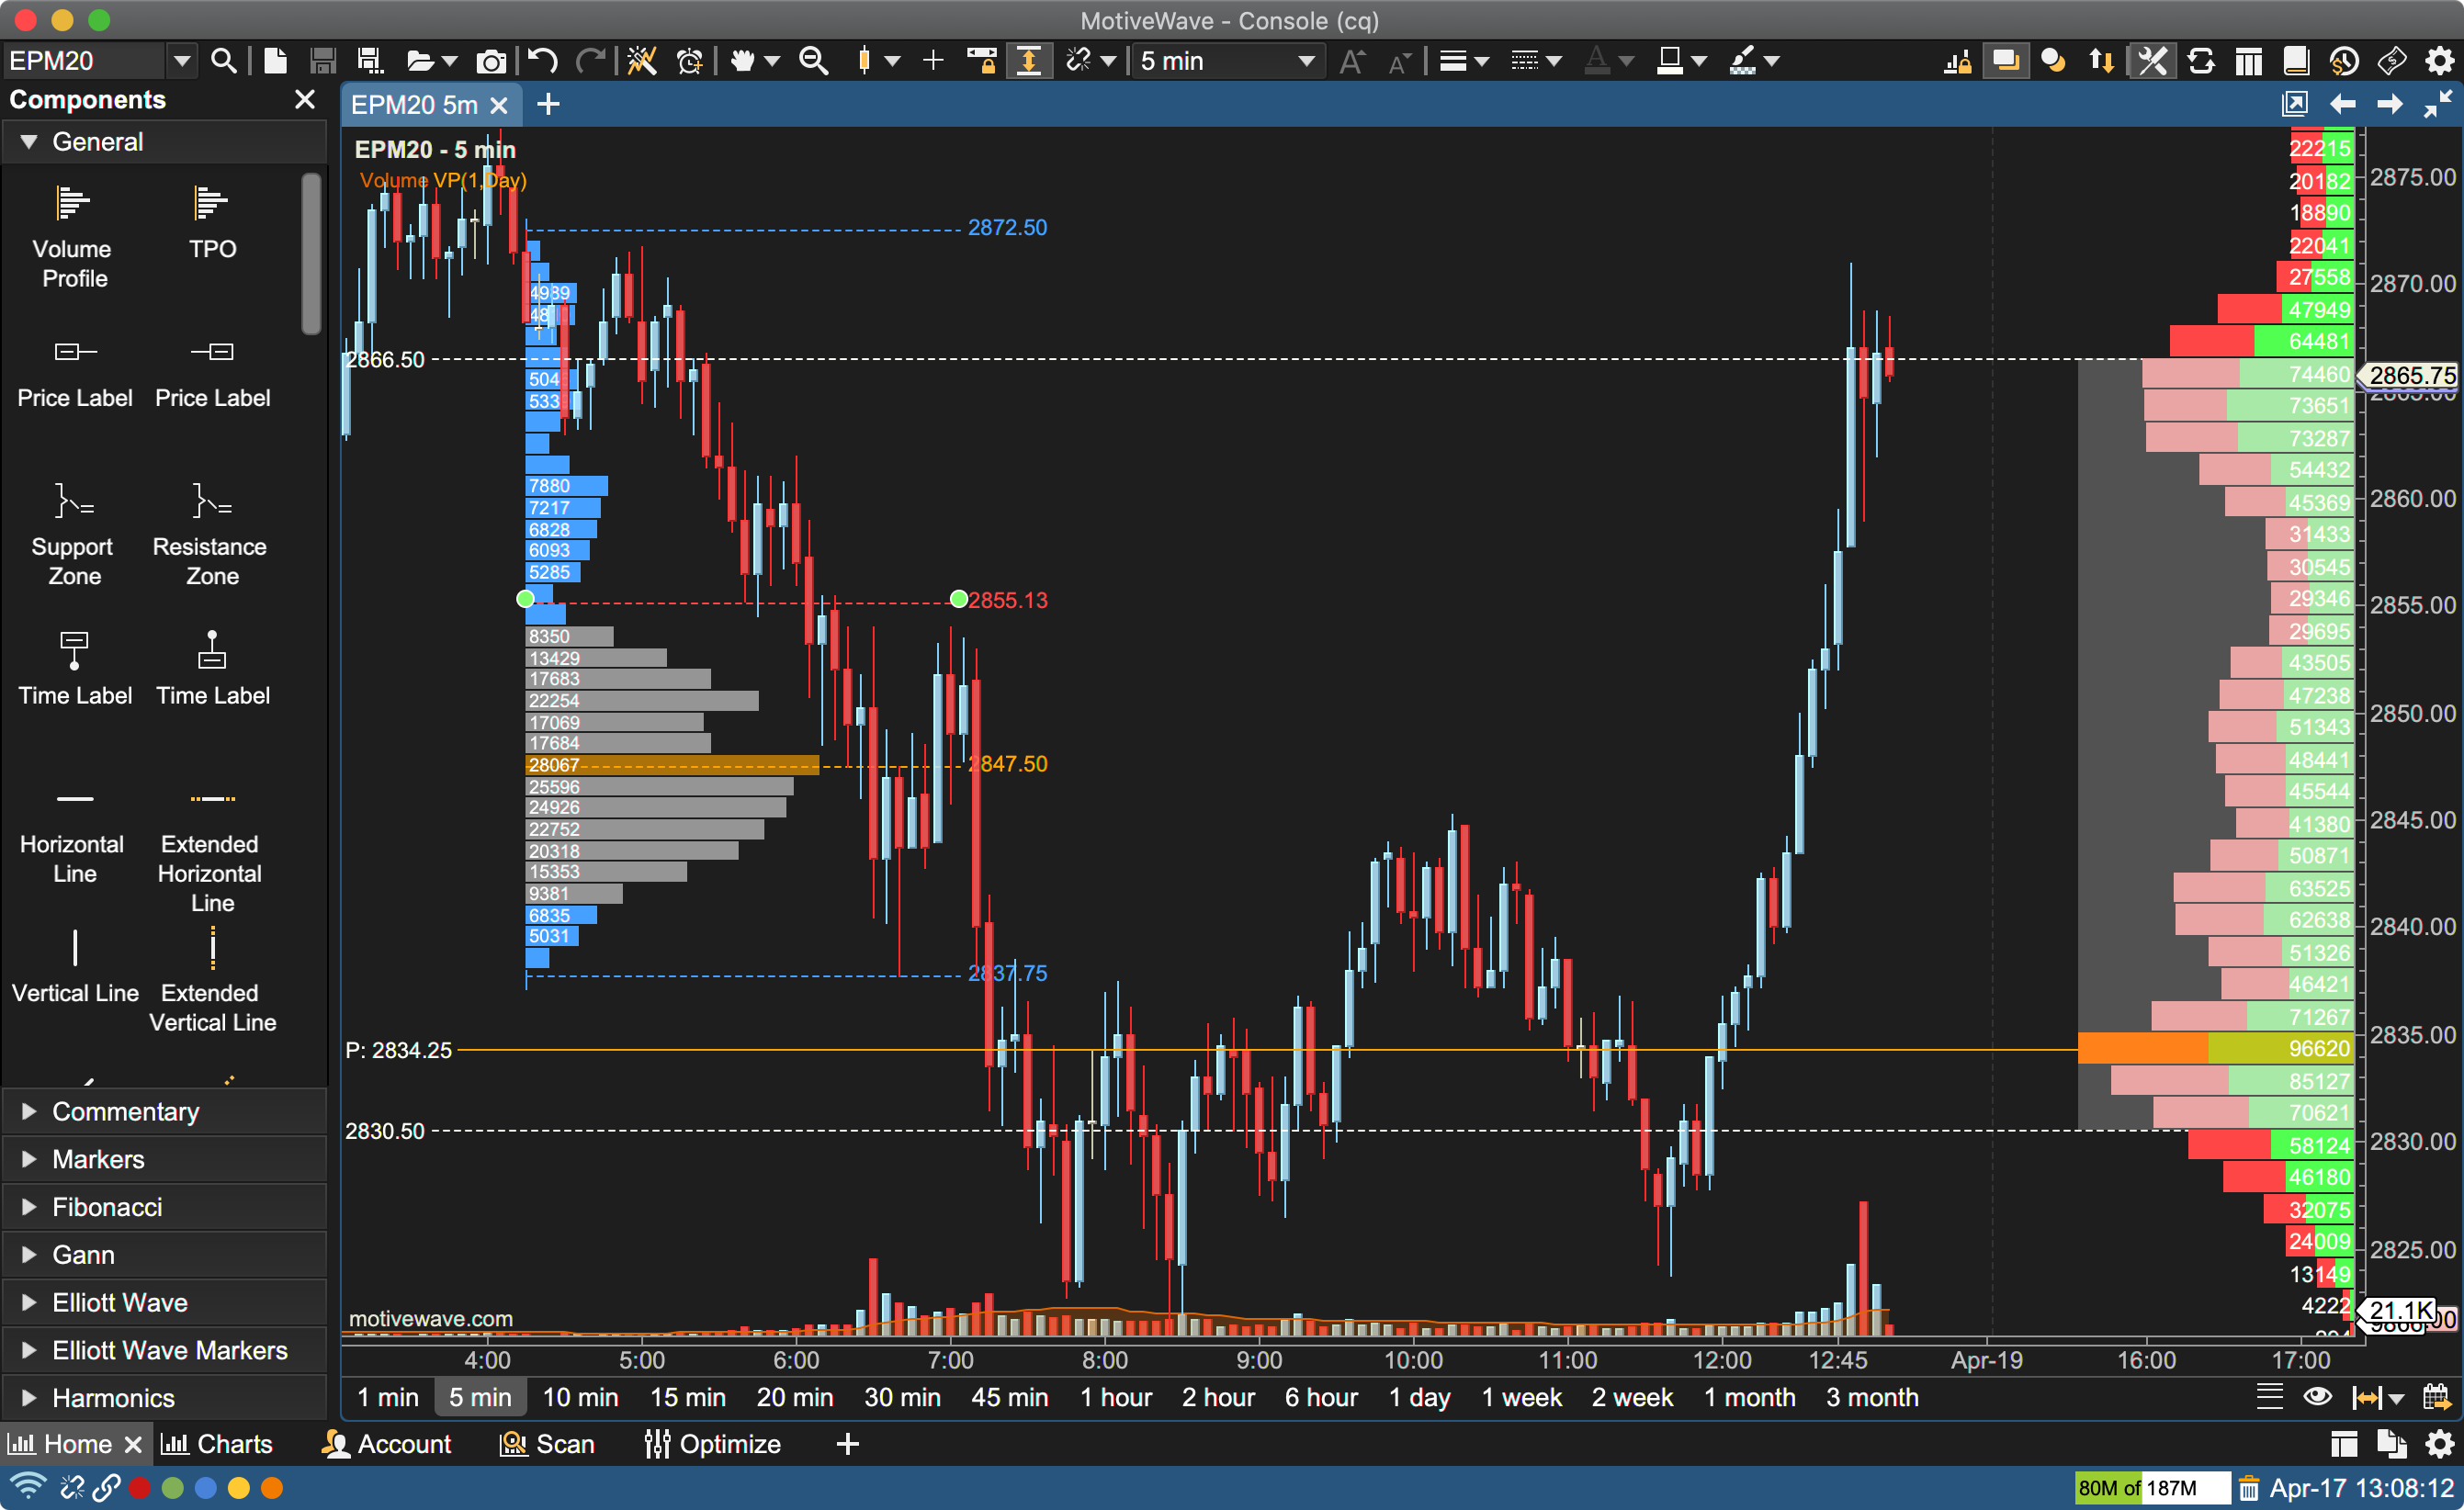
Volume Profile Study & Component
Additional Volume Profile Component offers a convenient way to drag/drop a Volume Profile onto a chart and dynamically adjust the range using the resize points. It uses tick data to display a histogram of volume at each price level for the given range of price bars. The volume profile will optionally compute common information such as:
- Value Area
- Point of Control
- Bid vs Ask Volume and Deltas
- Midpoint, High/Low values
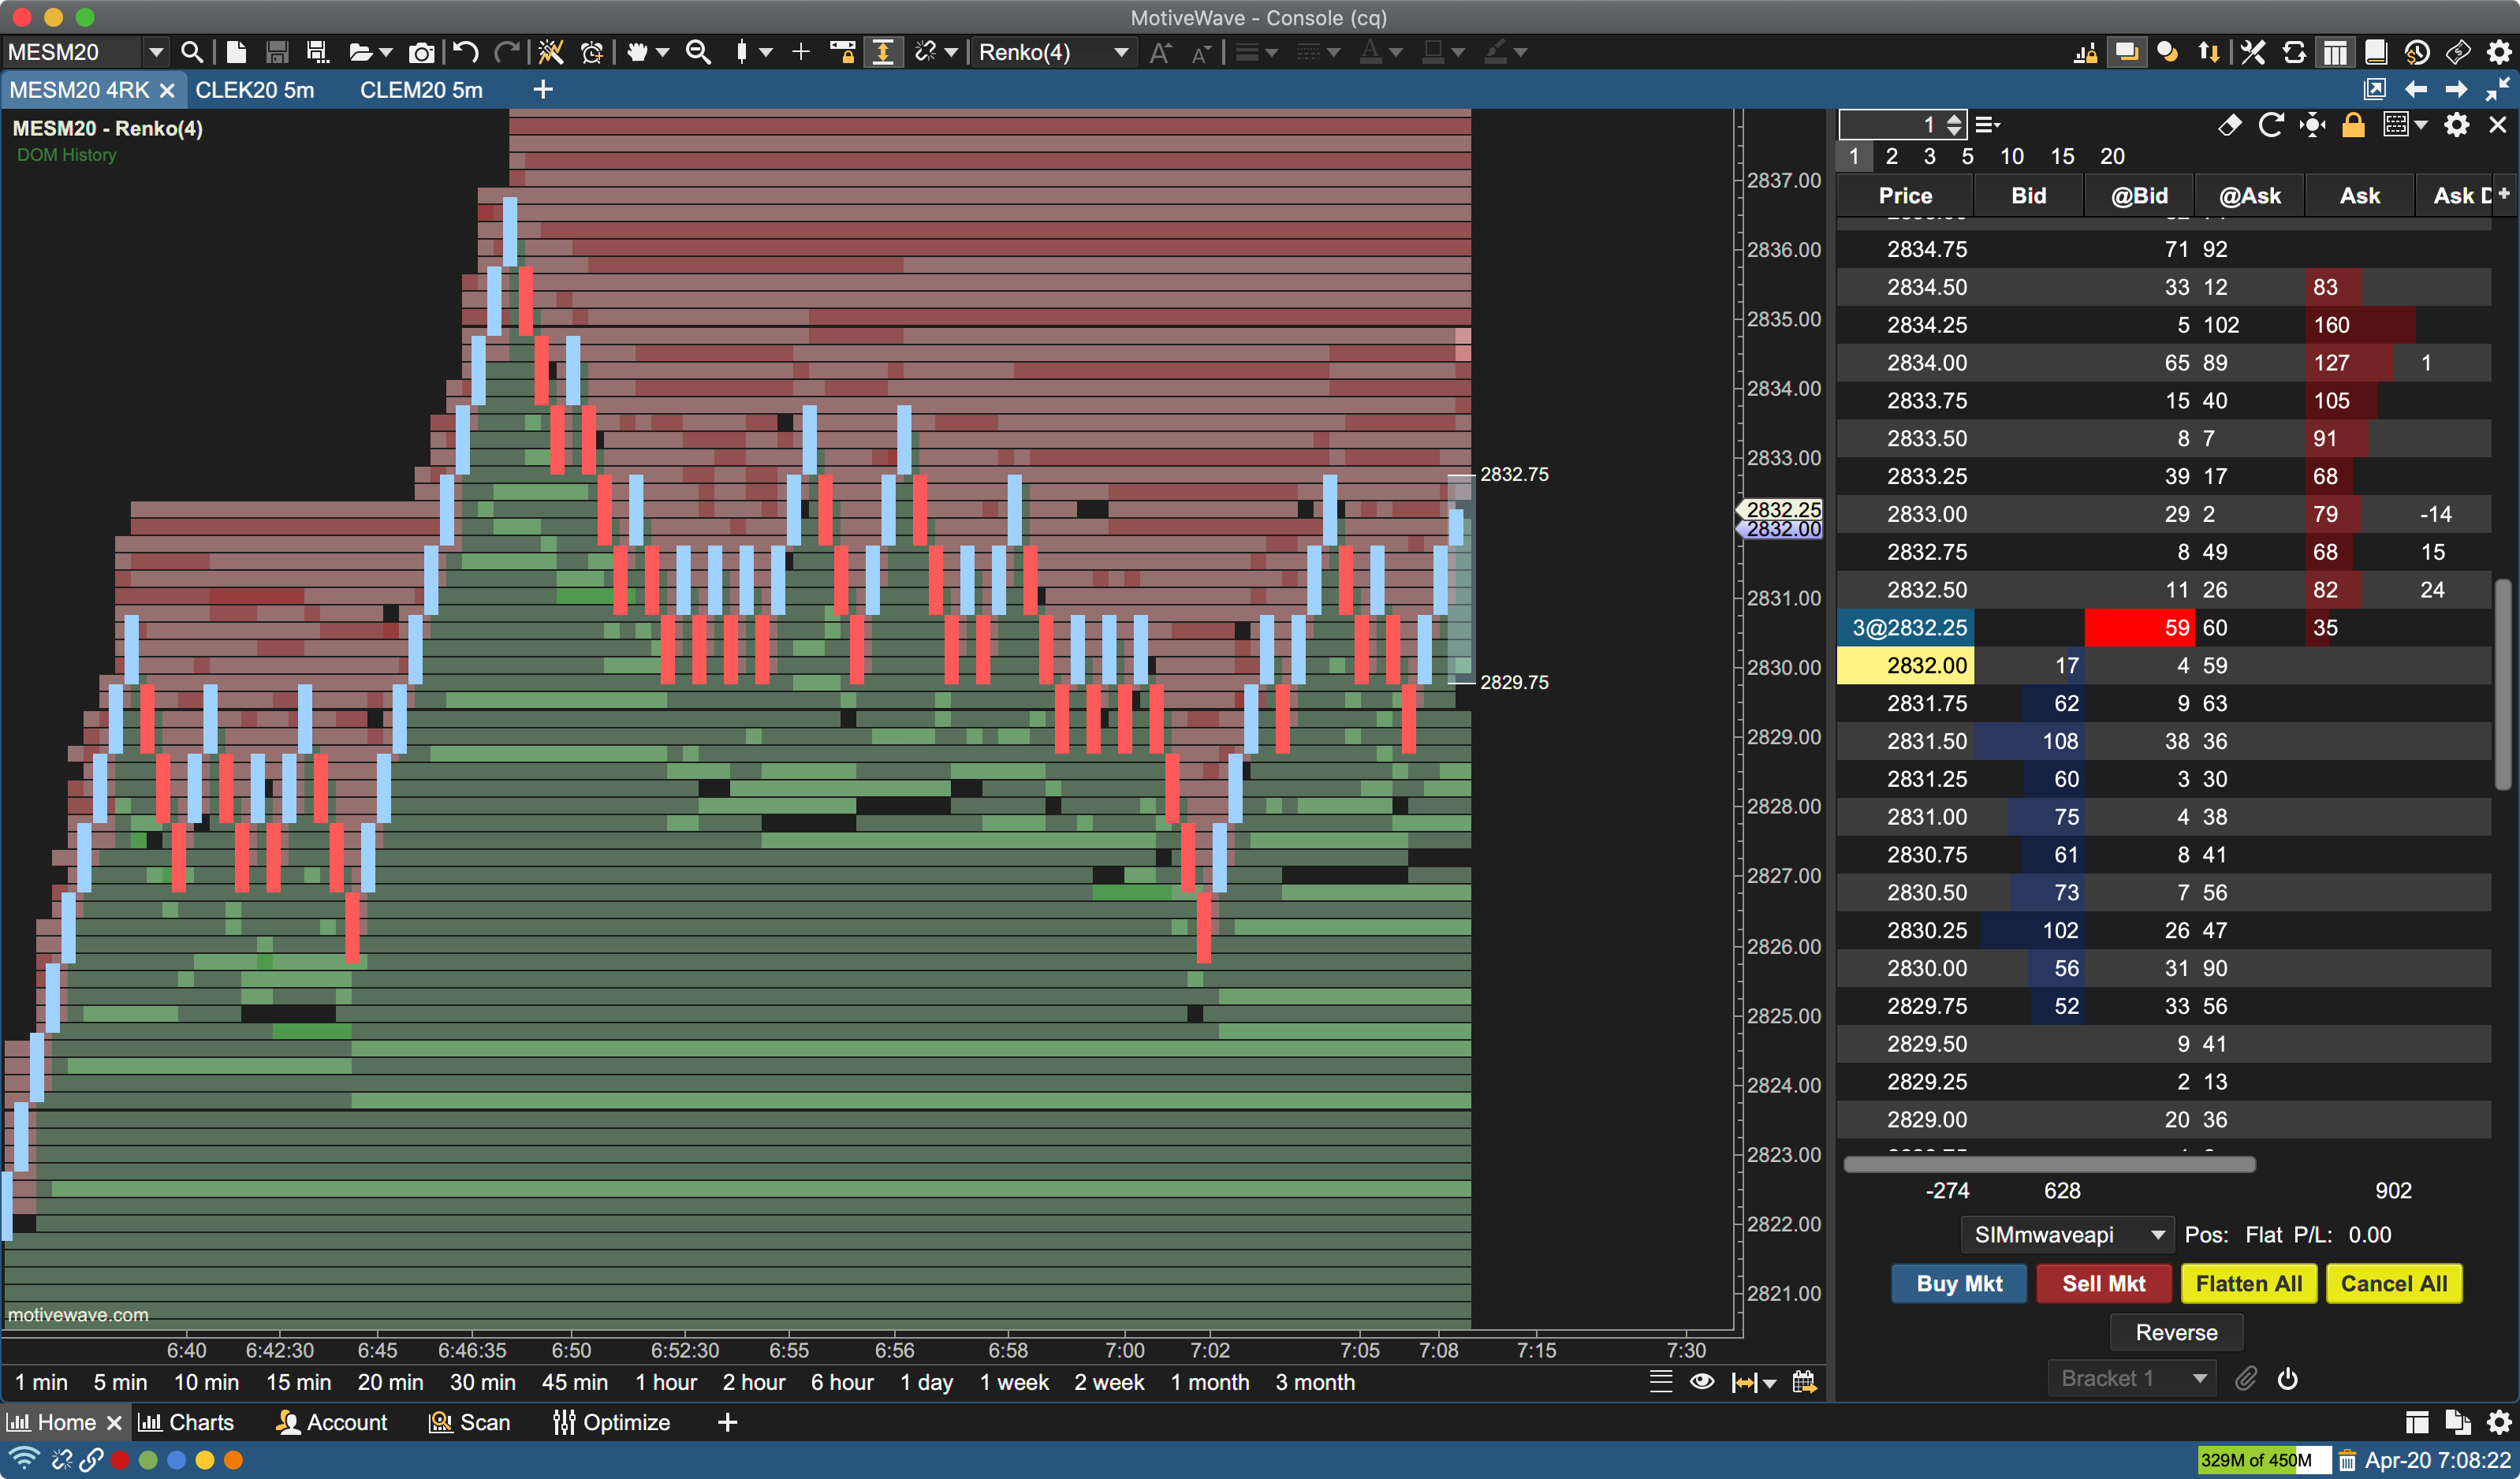
DOM History Study
It graphically displays historical Depth of Market sizes captured at the end of the bar. Blocks are shaded according to their relative size. Darker shading indicates higher sizes (lighter shading on dark chart themes). Blocks where no depth currently exists are extended forward to show where orders may still exist.
This study can be very useful to discover where potential support and resistance levels exist based on the cumulative size of the orders to buy or sell at the given price.
The DOM History Study is included in our Order Flow Studies Pack (shown below).
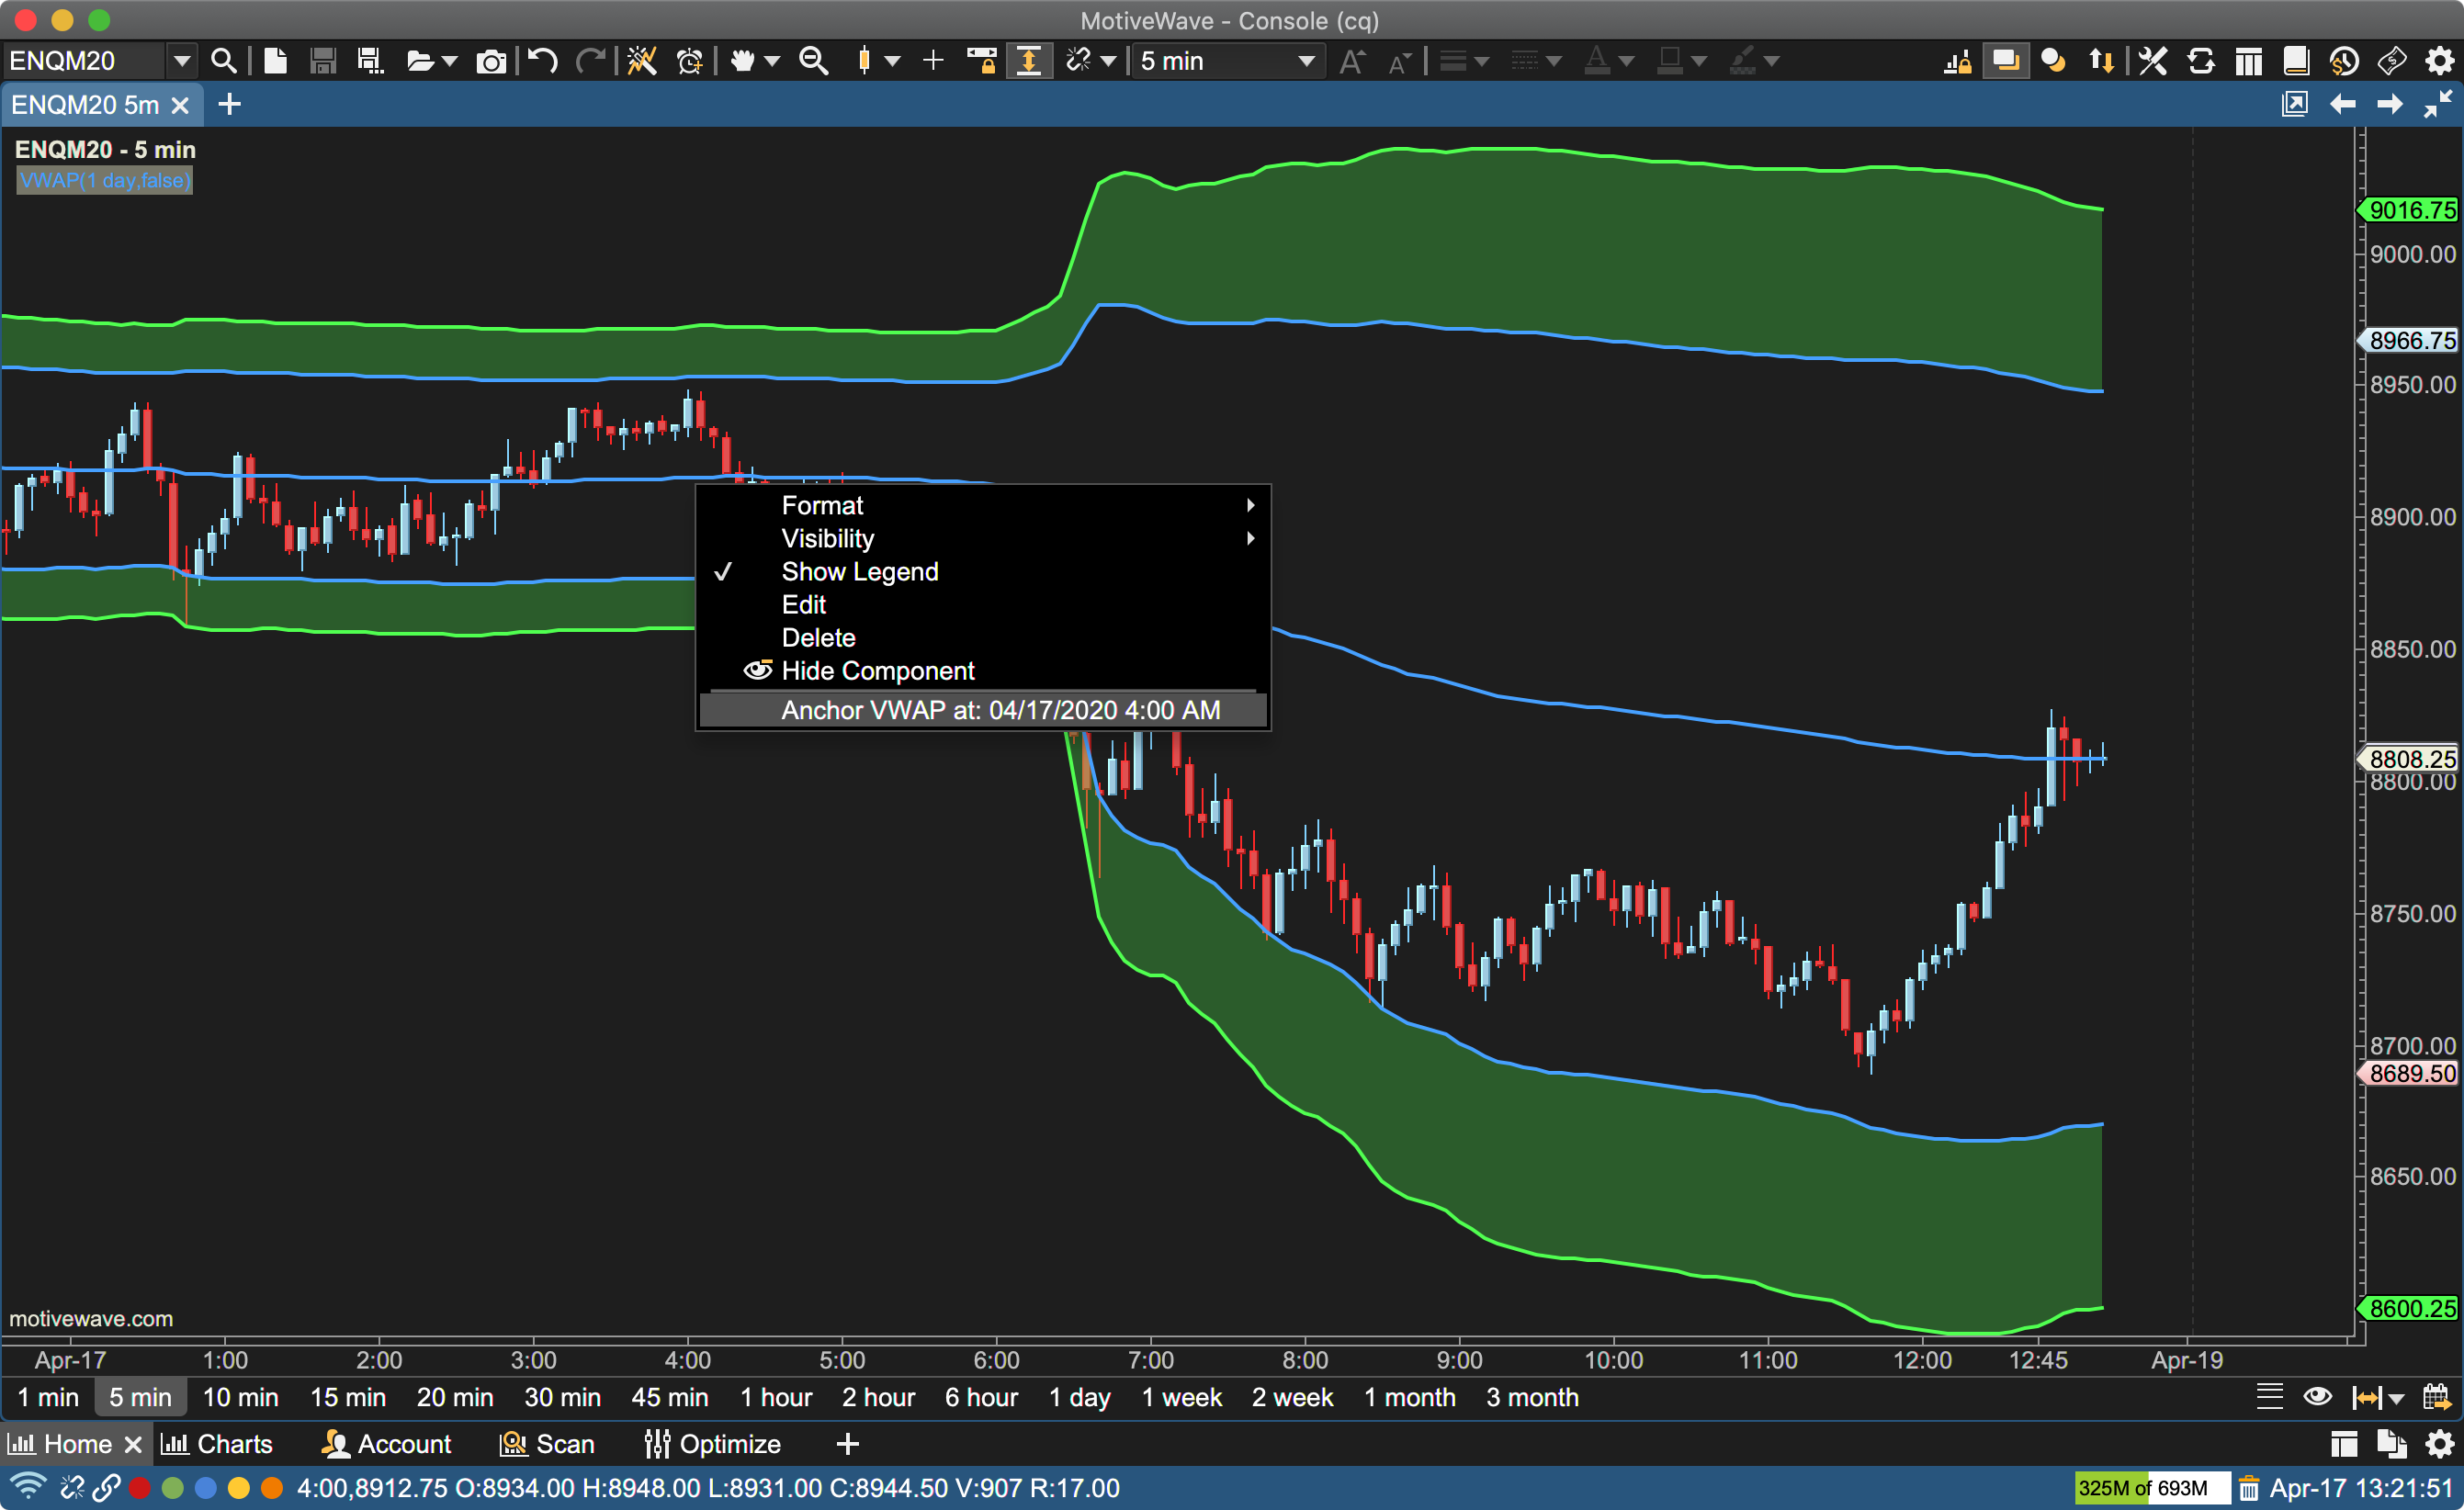
VWAP (Volume Weighted Average Price) with Standard Deviation and Anchors
- Set up to 3 Standard Deviation Bands
- Use Anchors to set the starting point for calculating the VWAP
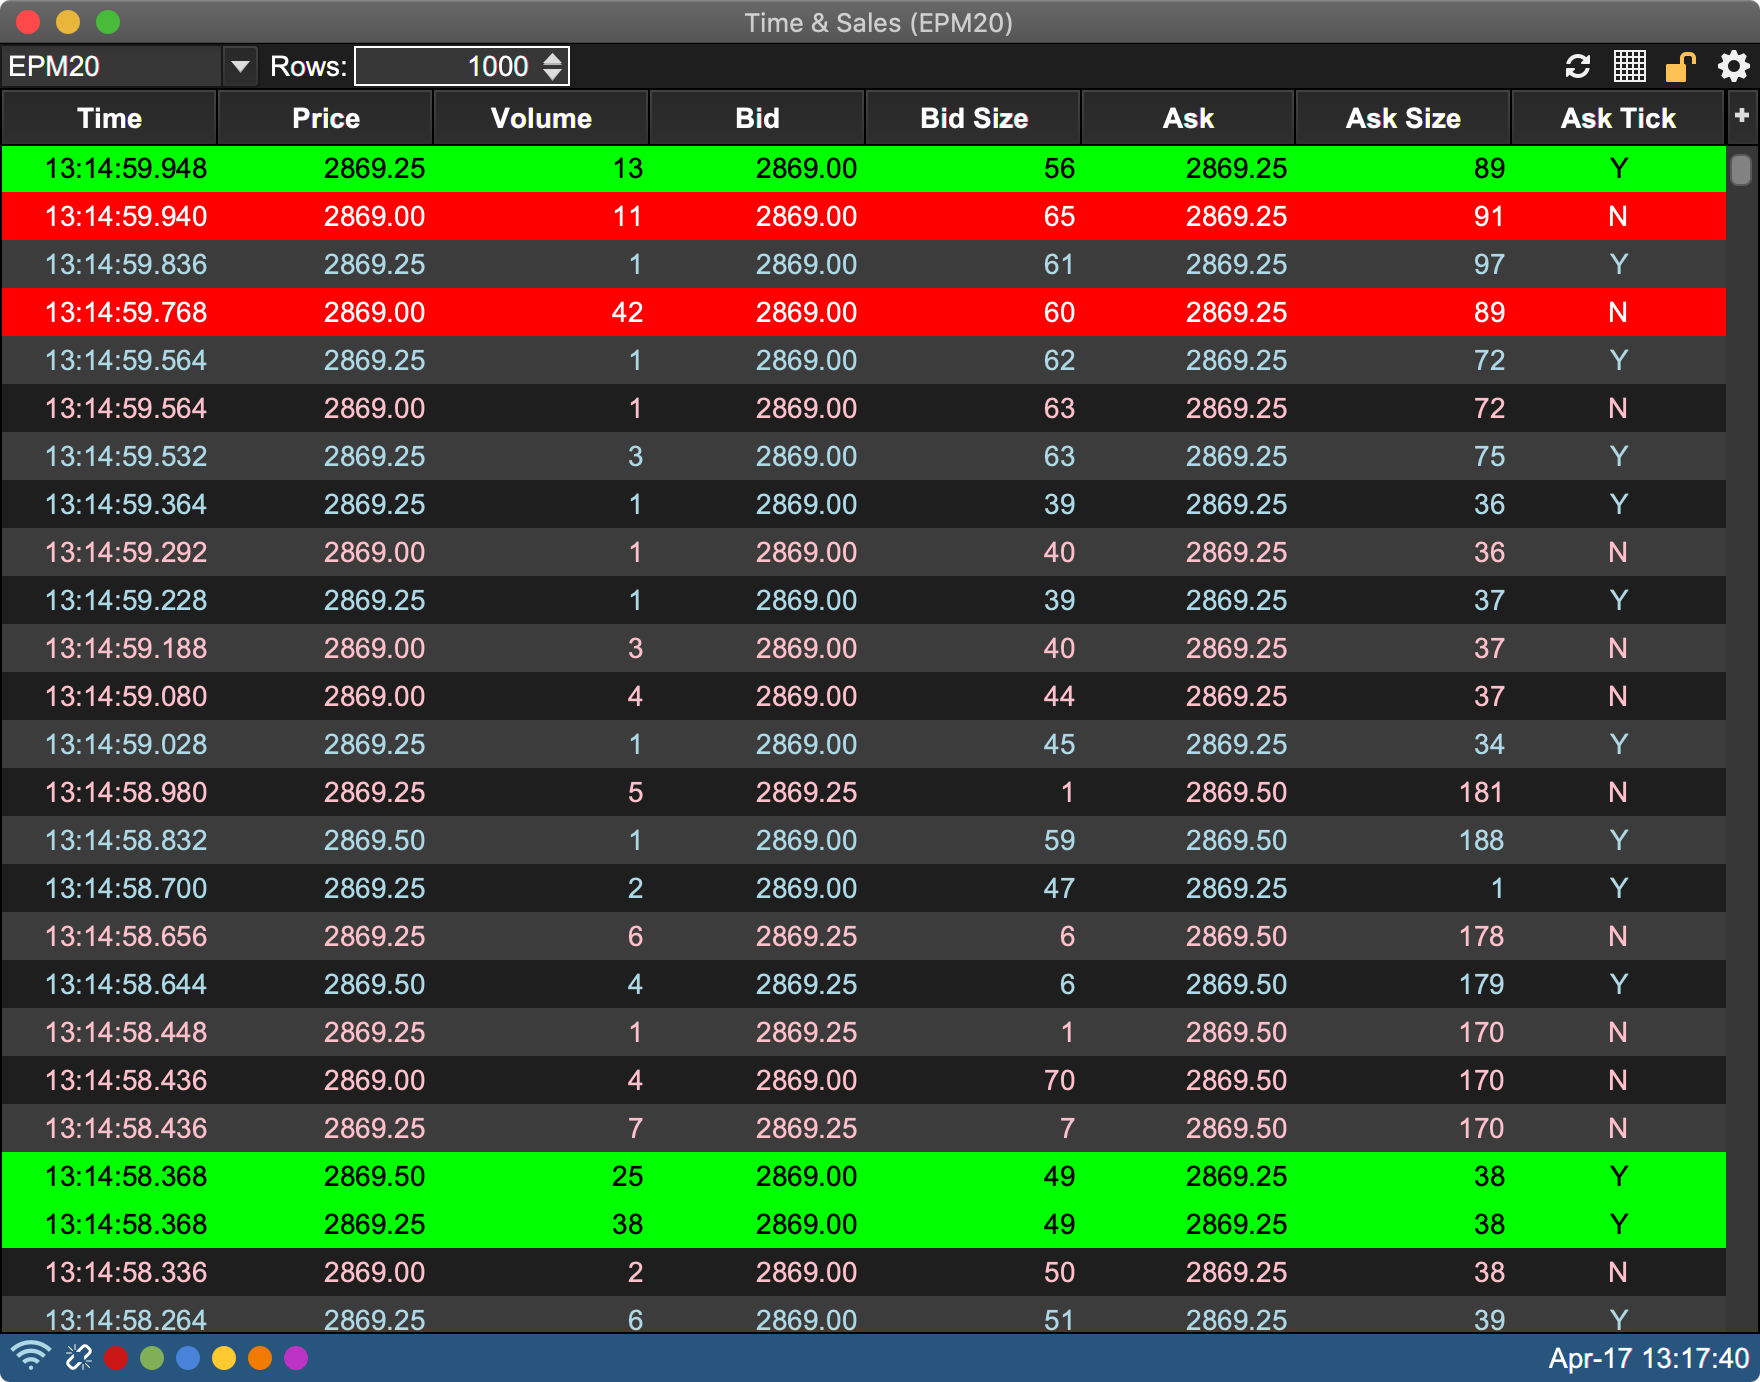
Time and Sales
This tells you if there are currently more buyers or sellers, and what prices they are buying and selling at.
- Highly customizable Time and Sales to match your preferences
- Highlight Big Sizes
- Aggregate Periods
- Min/Max Trade Size
Big Trades Study
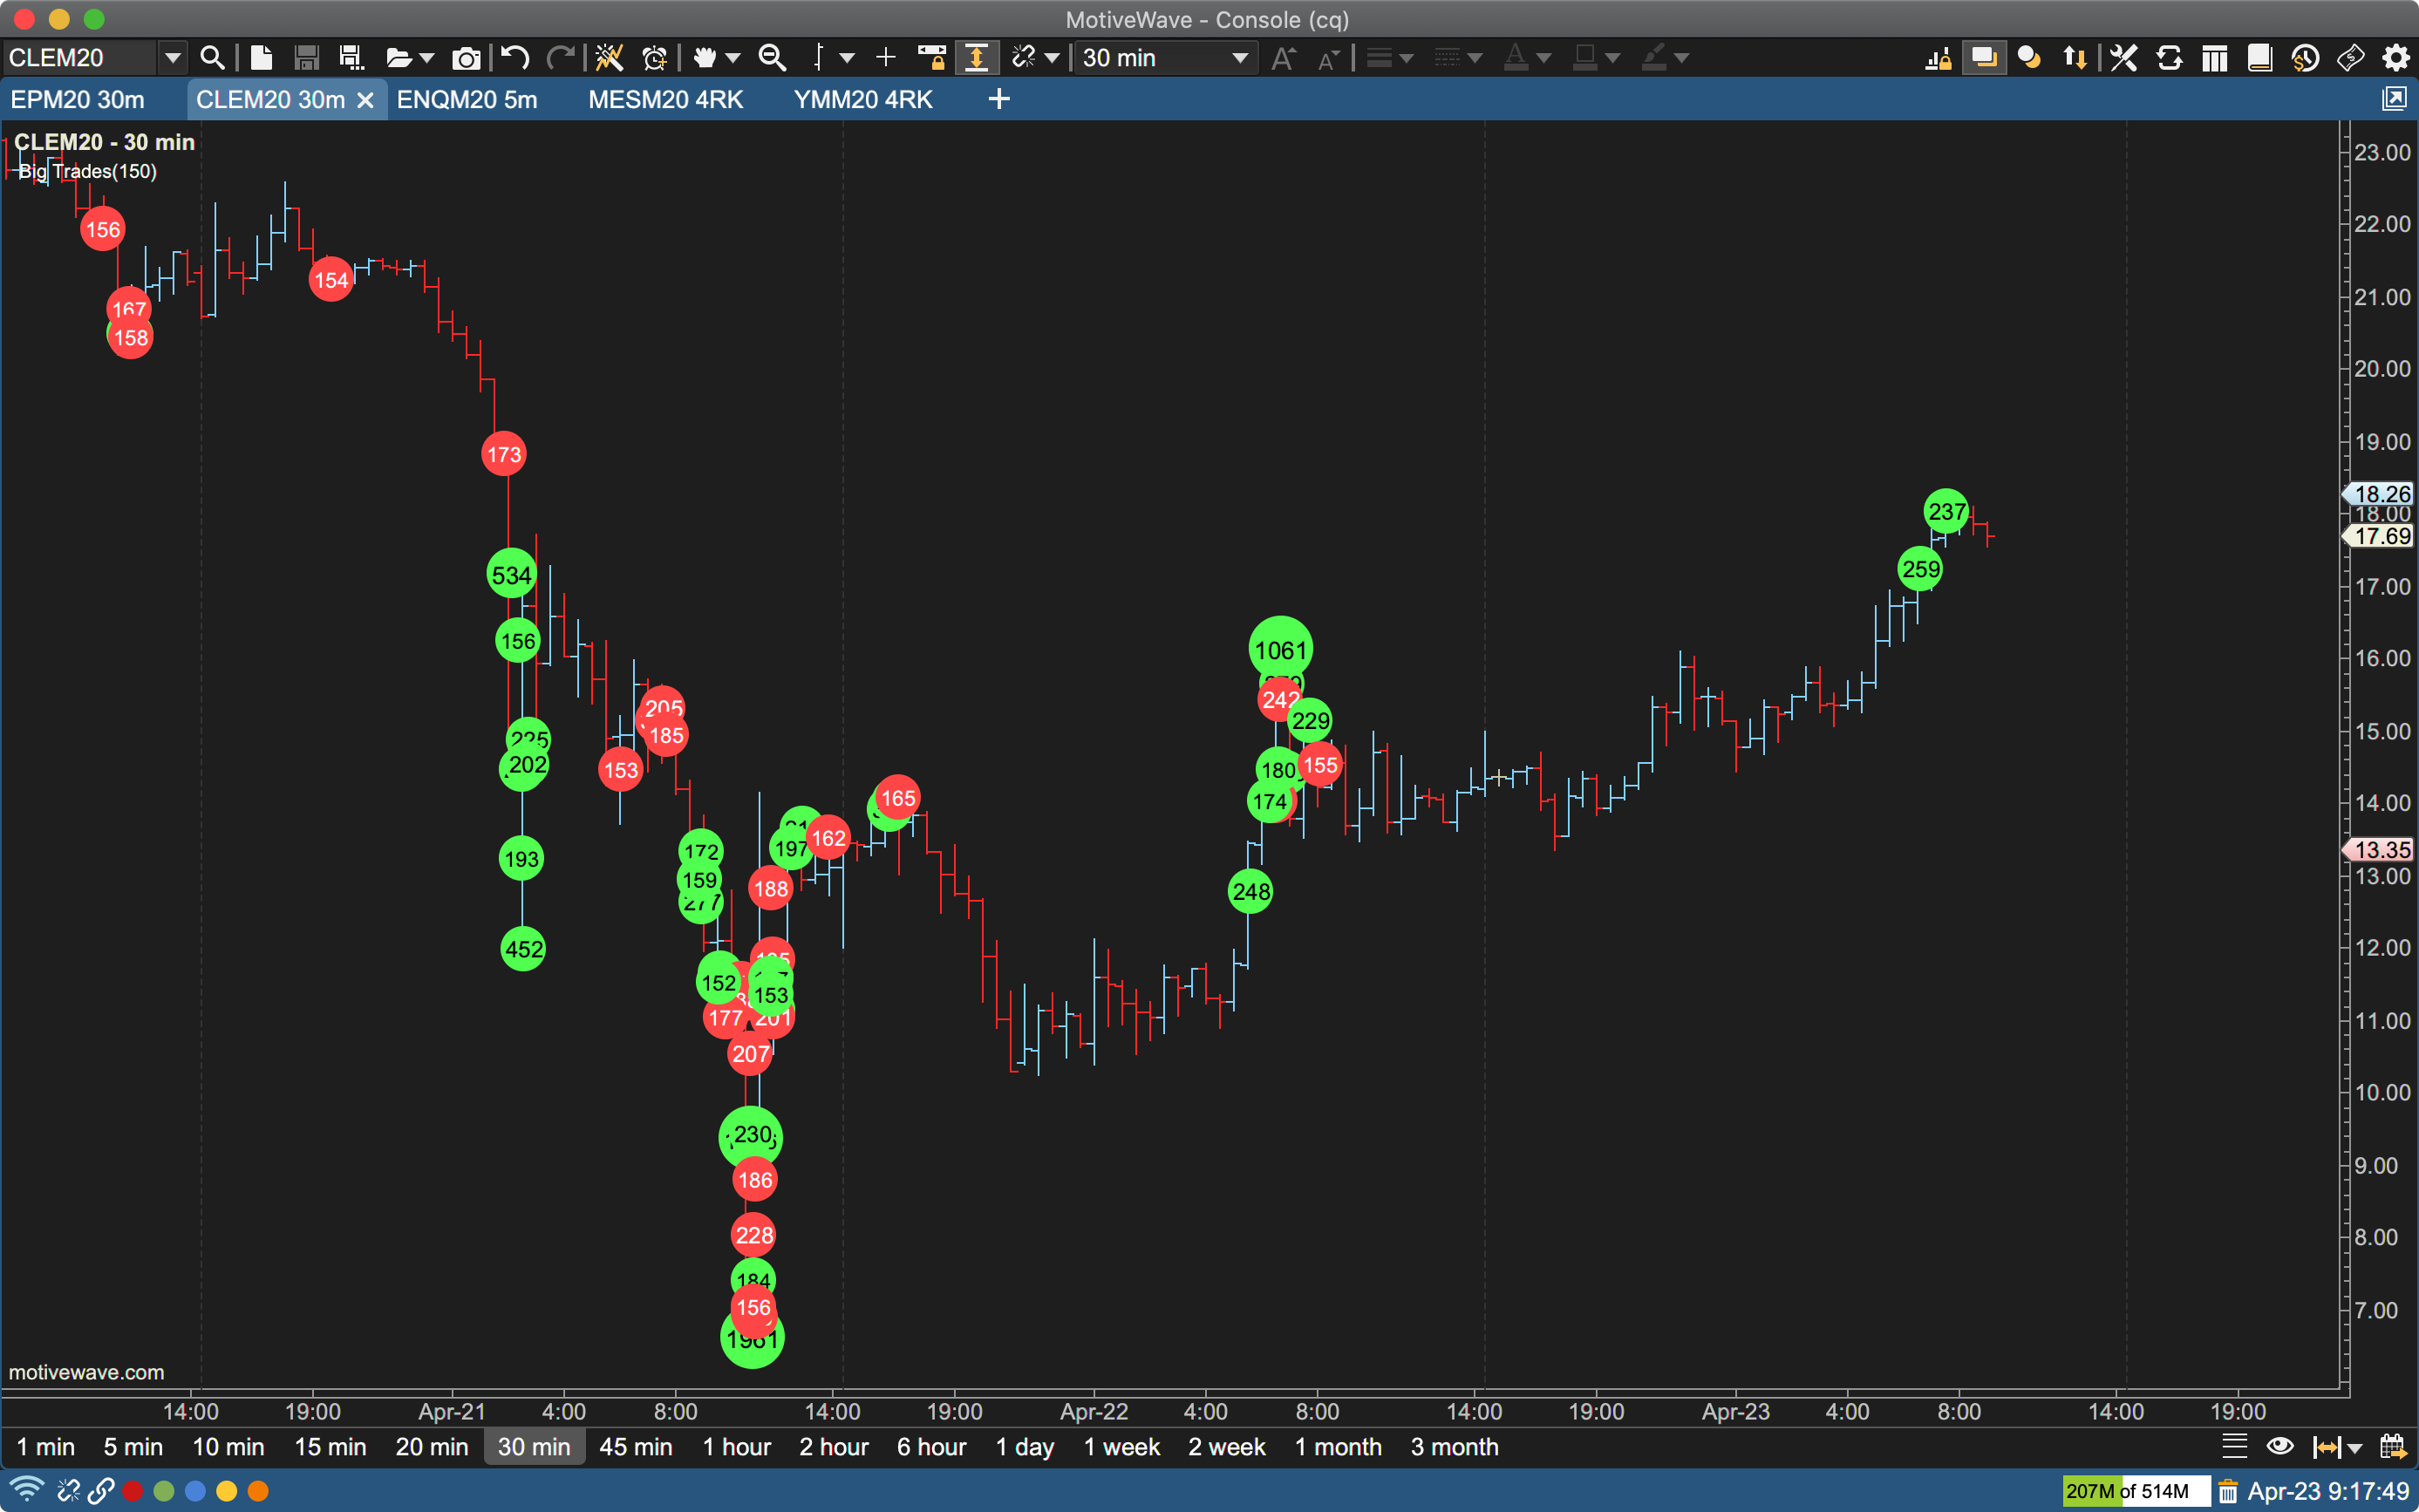
Shows historical trades on the chart that are greater than or equal to the given minimum size. This lets you see the large trades to see how big traders are positioned.
Speed Gauge Study
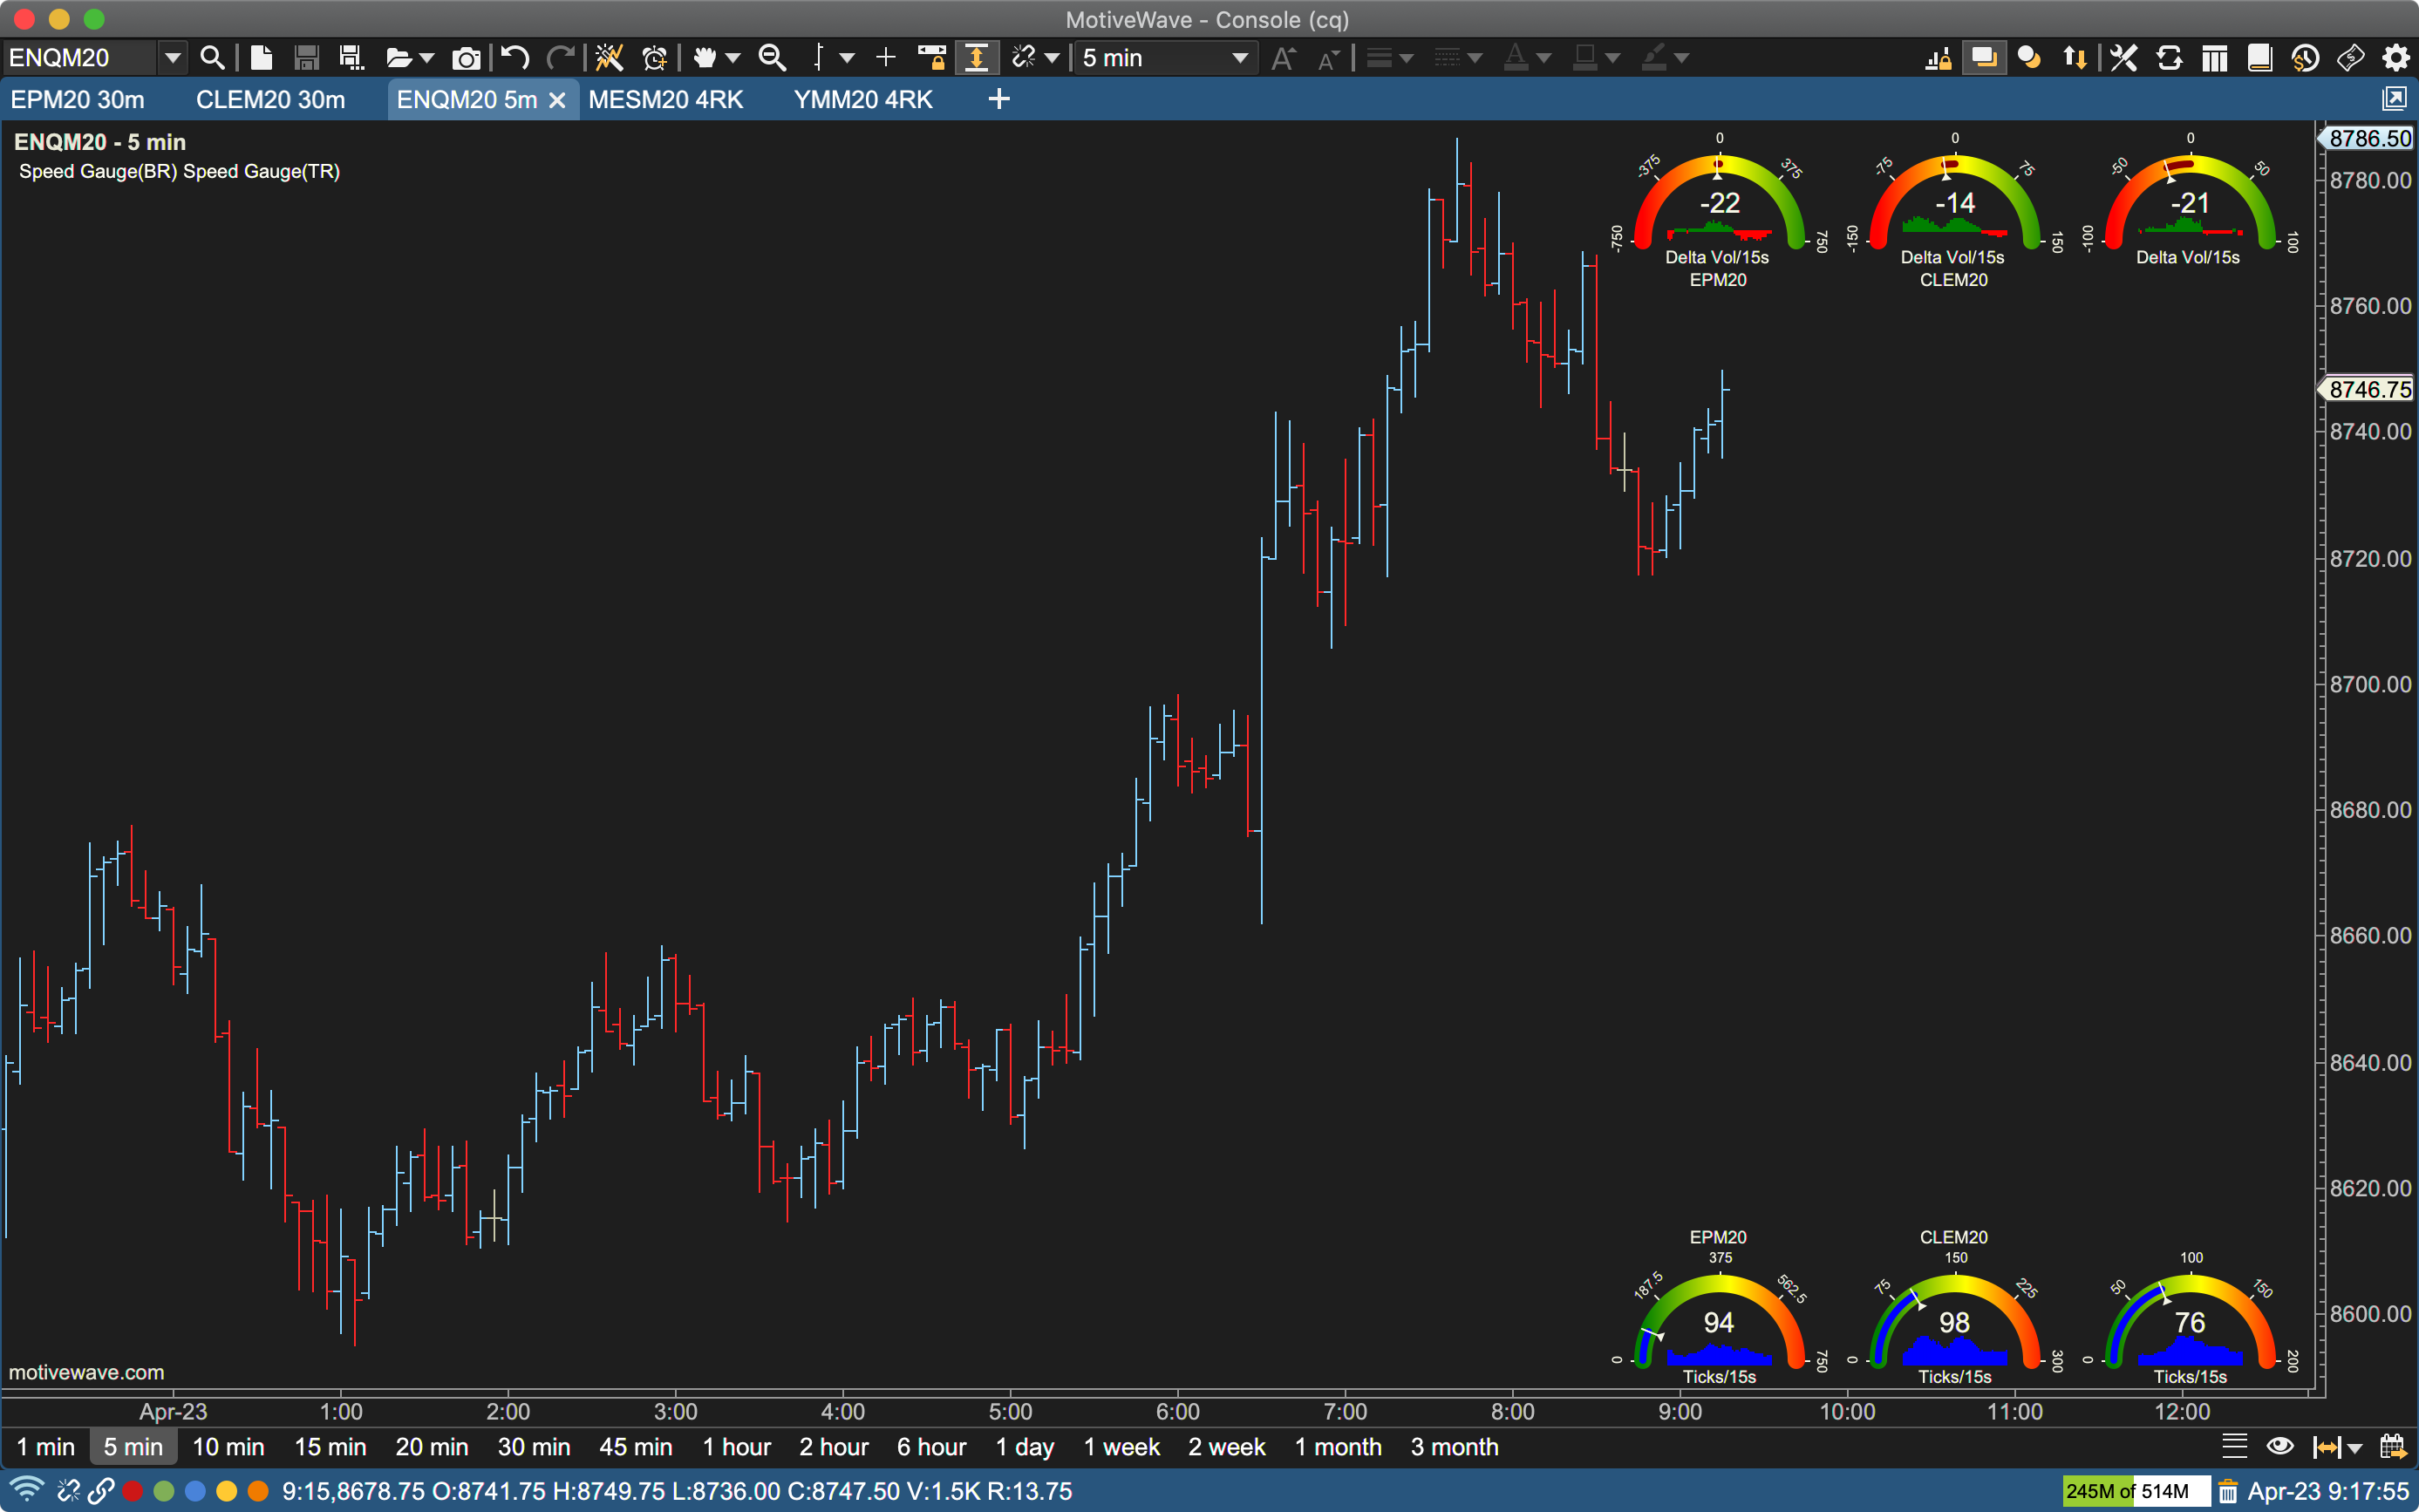
Displays live statistical values graphically on the price graph.
Depth of Market Study
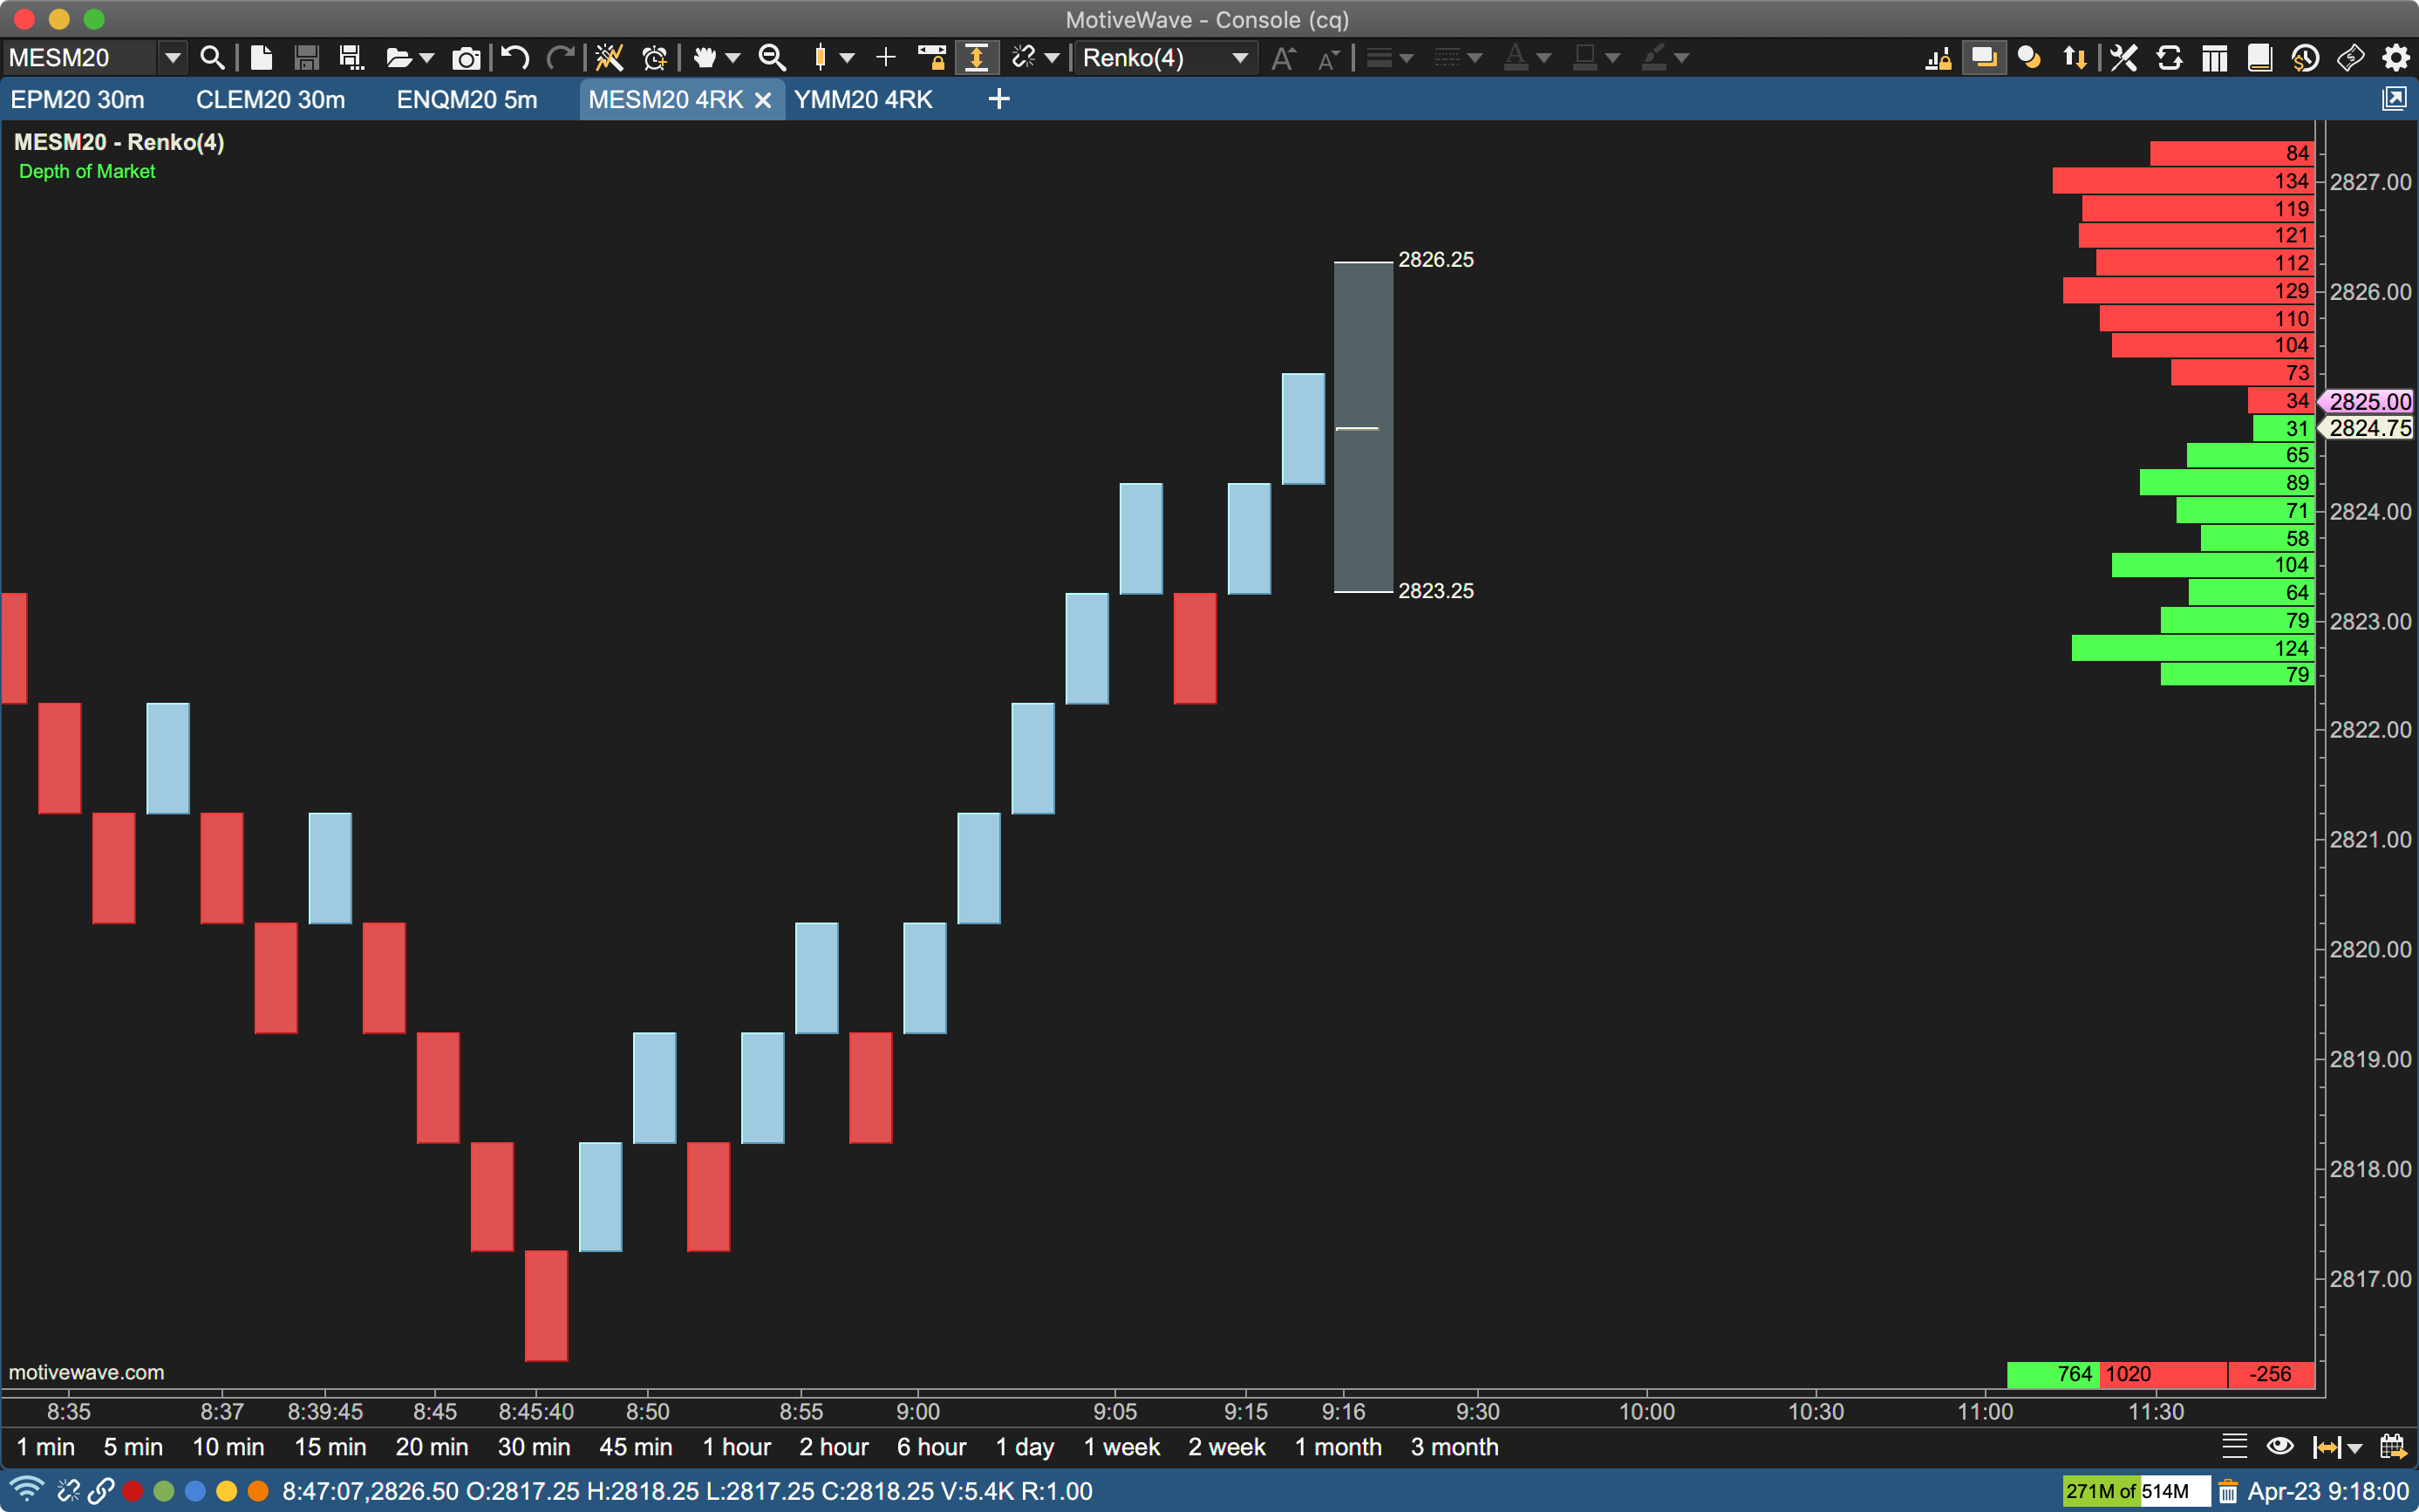
Displays the available bid/ask sizes at each price level on the chart instead of in a separate DOM panel or window.
Speed of Tape Study
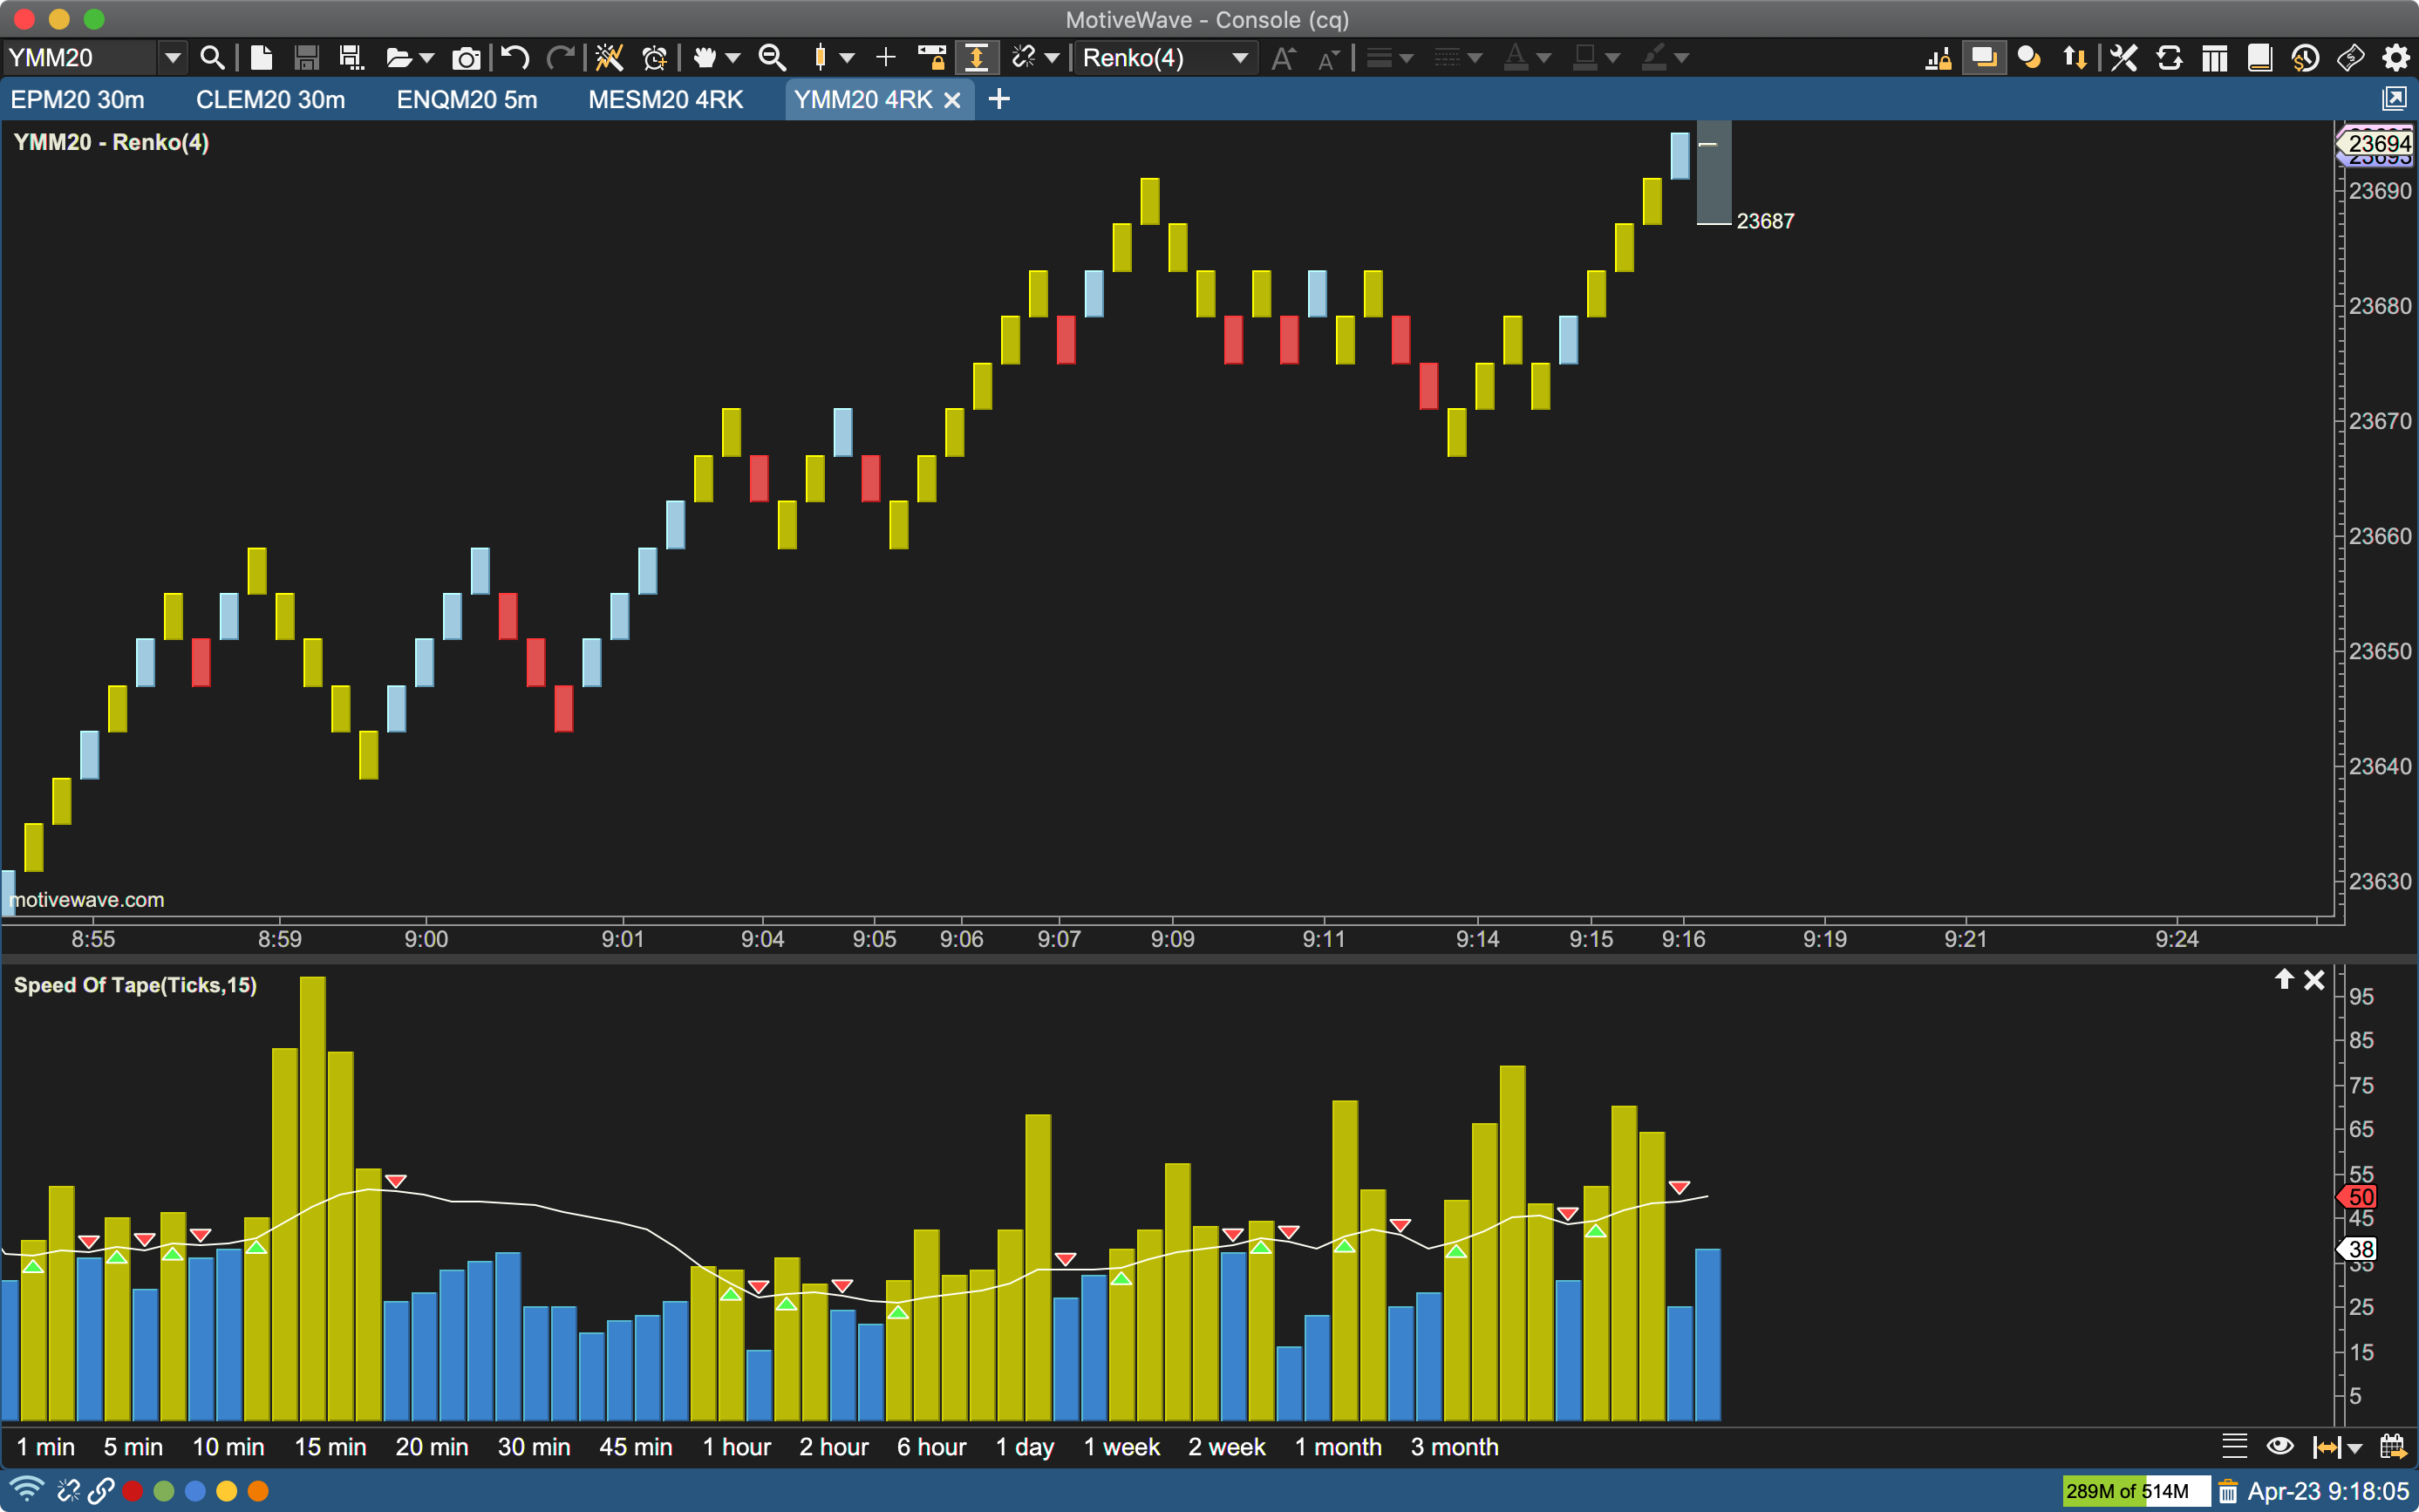
Measures and displays the current and historical speed pace of the market for a given statistic over an interval (in seconds).
DOM Power Study
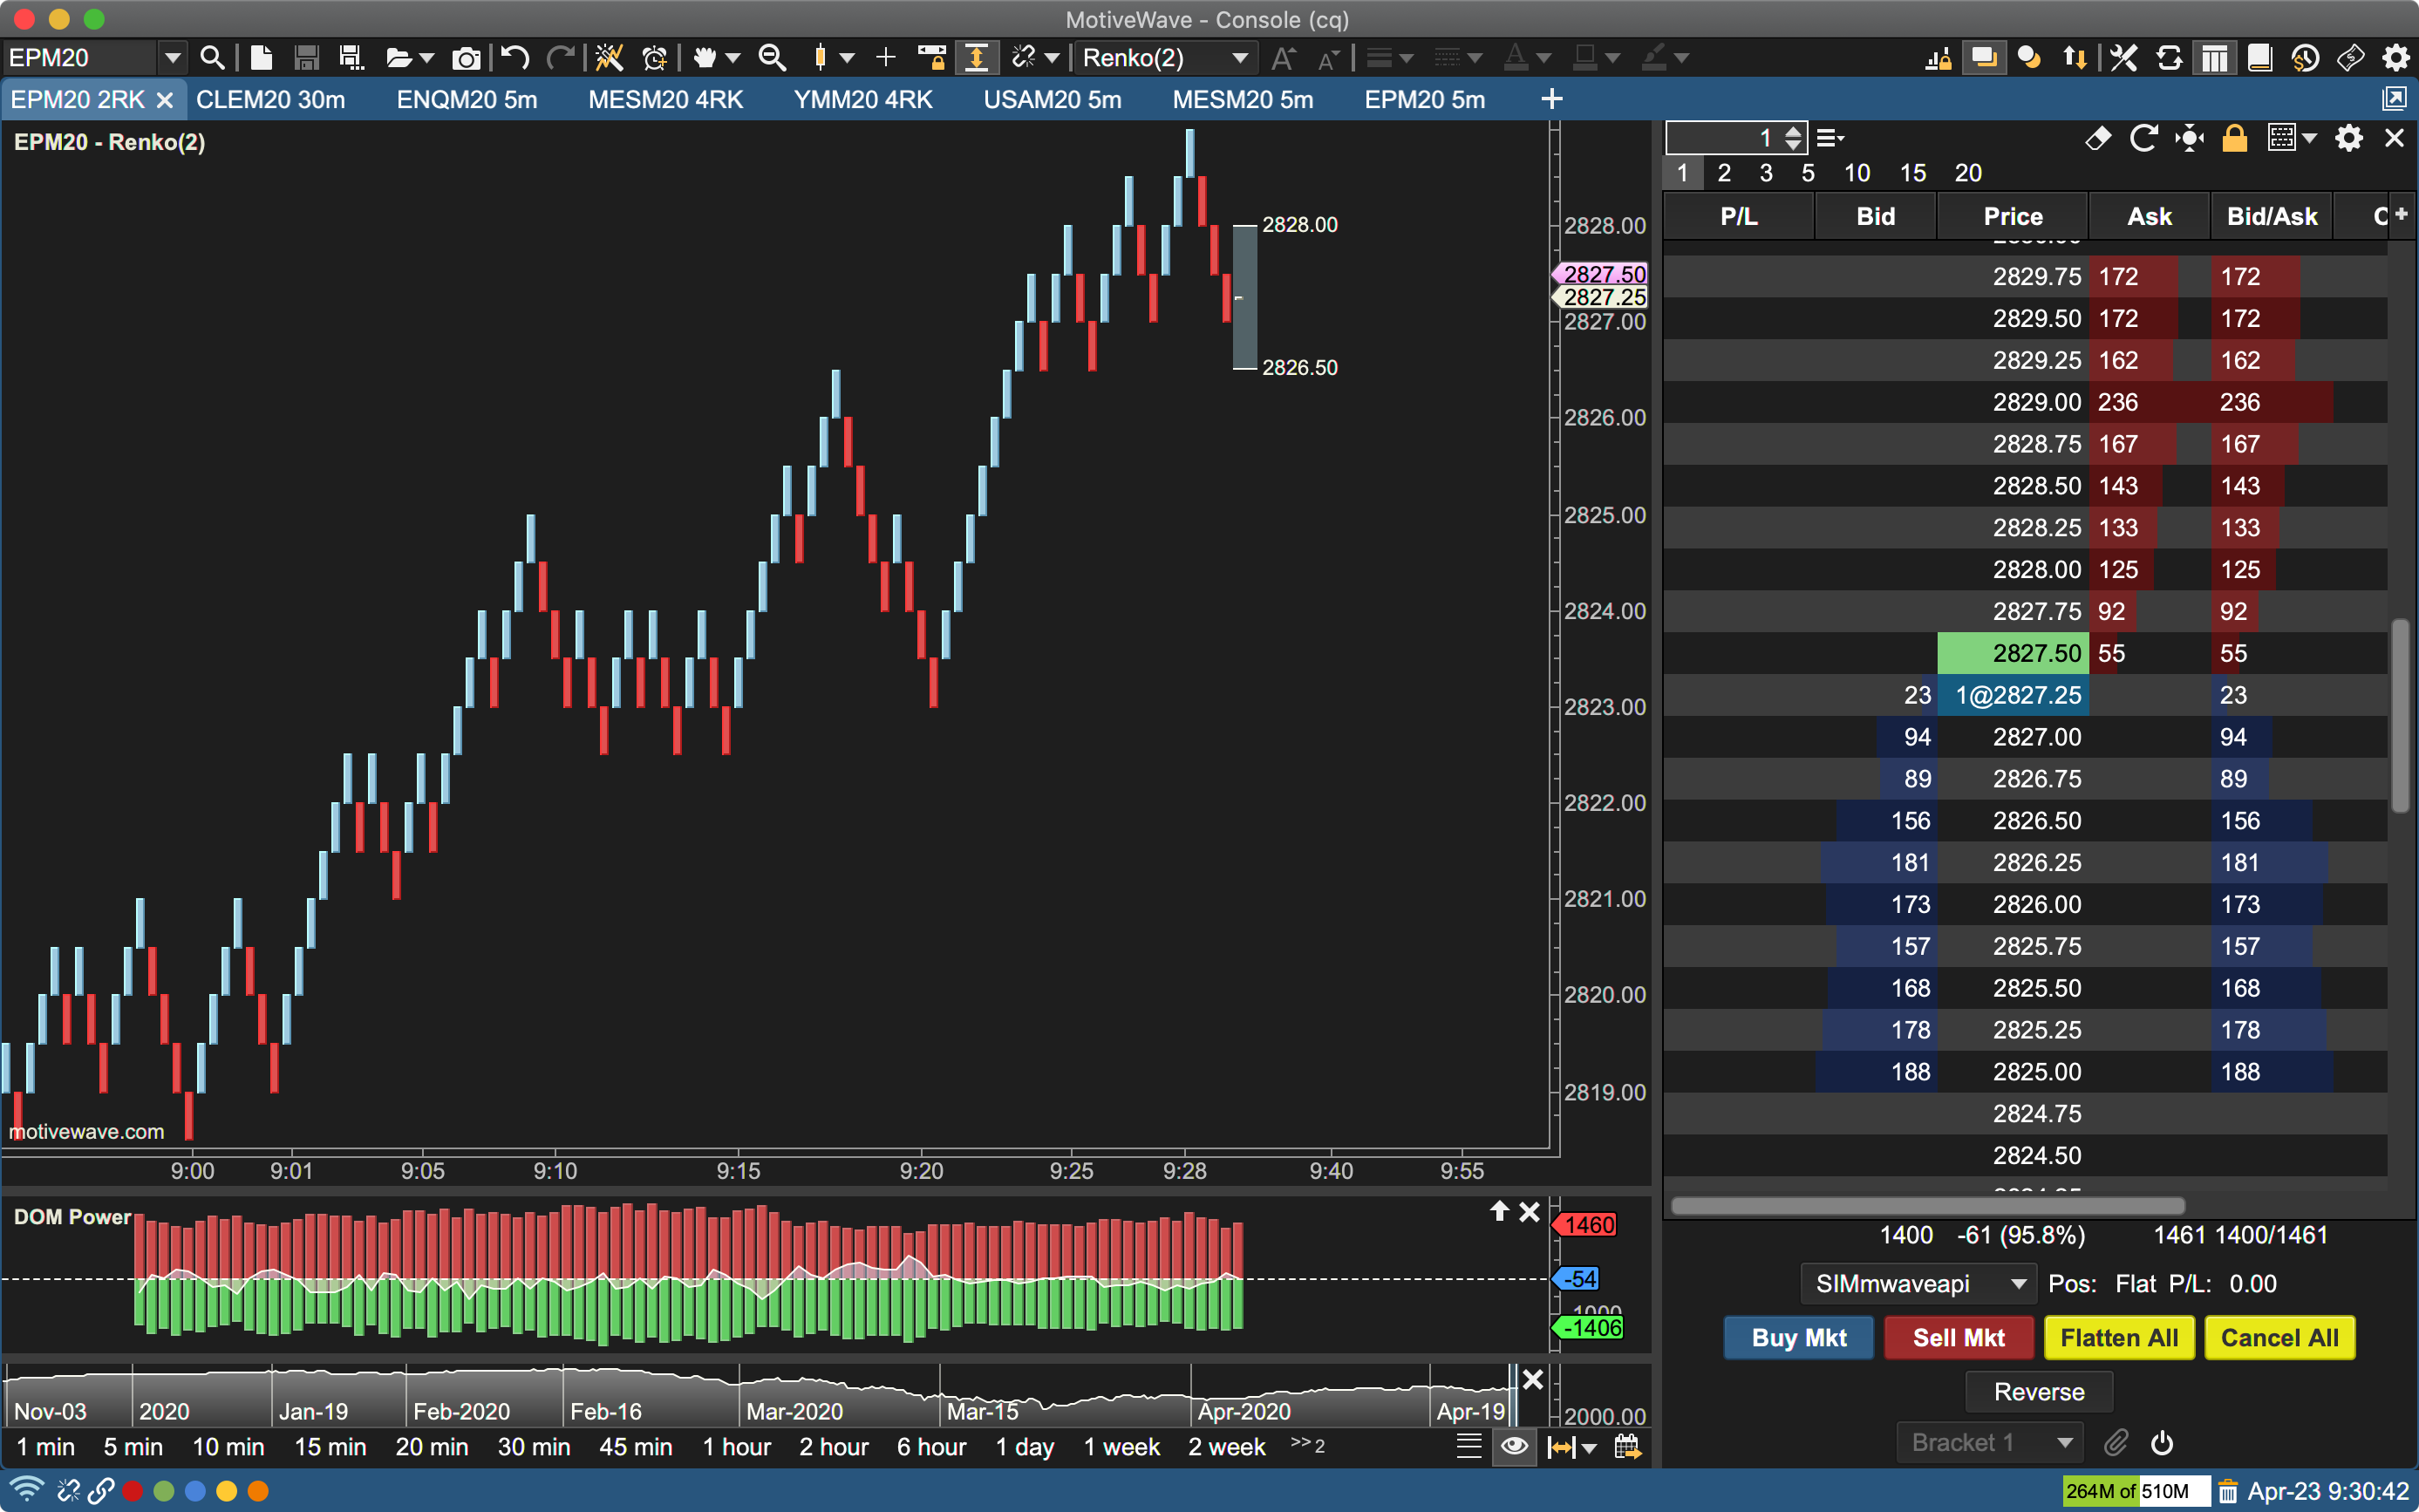
Displays current/historical order demand at the bid and ask. The delta is displayed to show where support and resistance exists.
Bid/Ask Volume Study
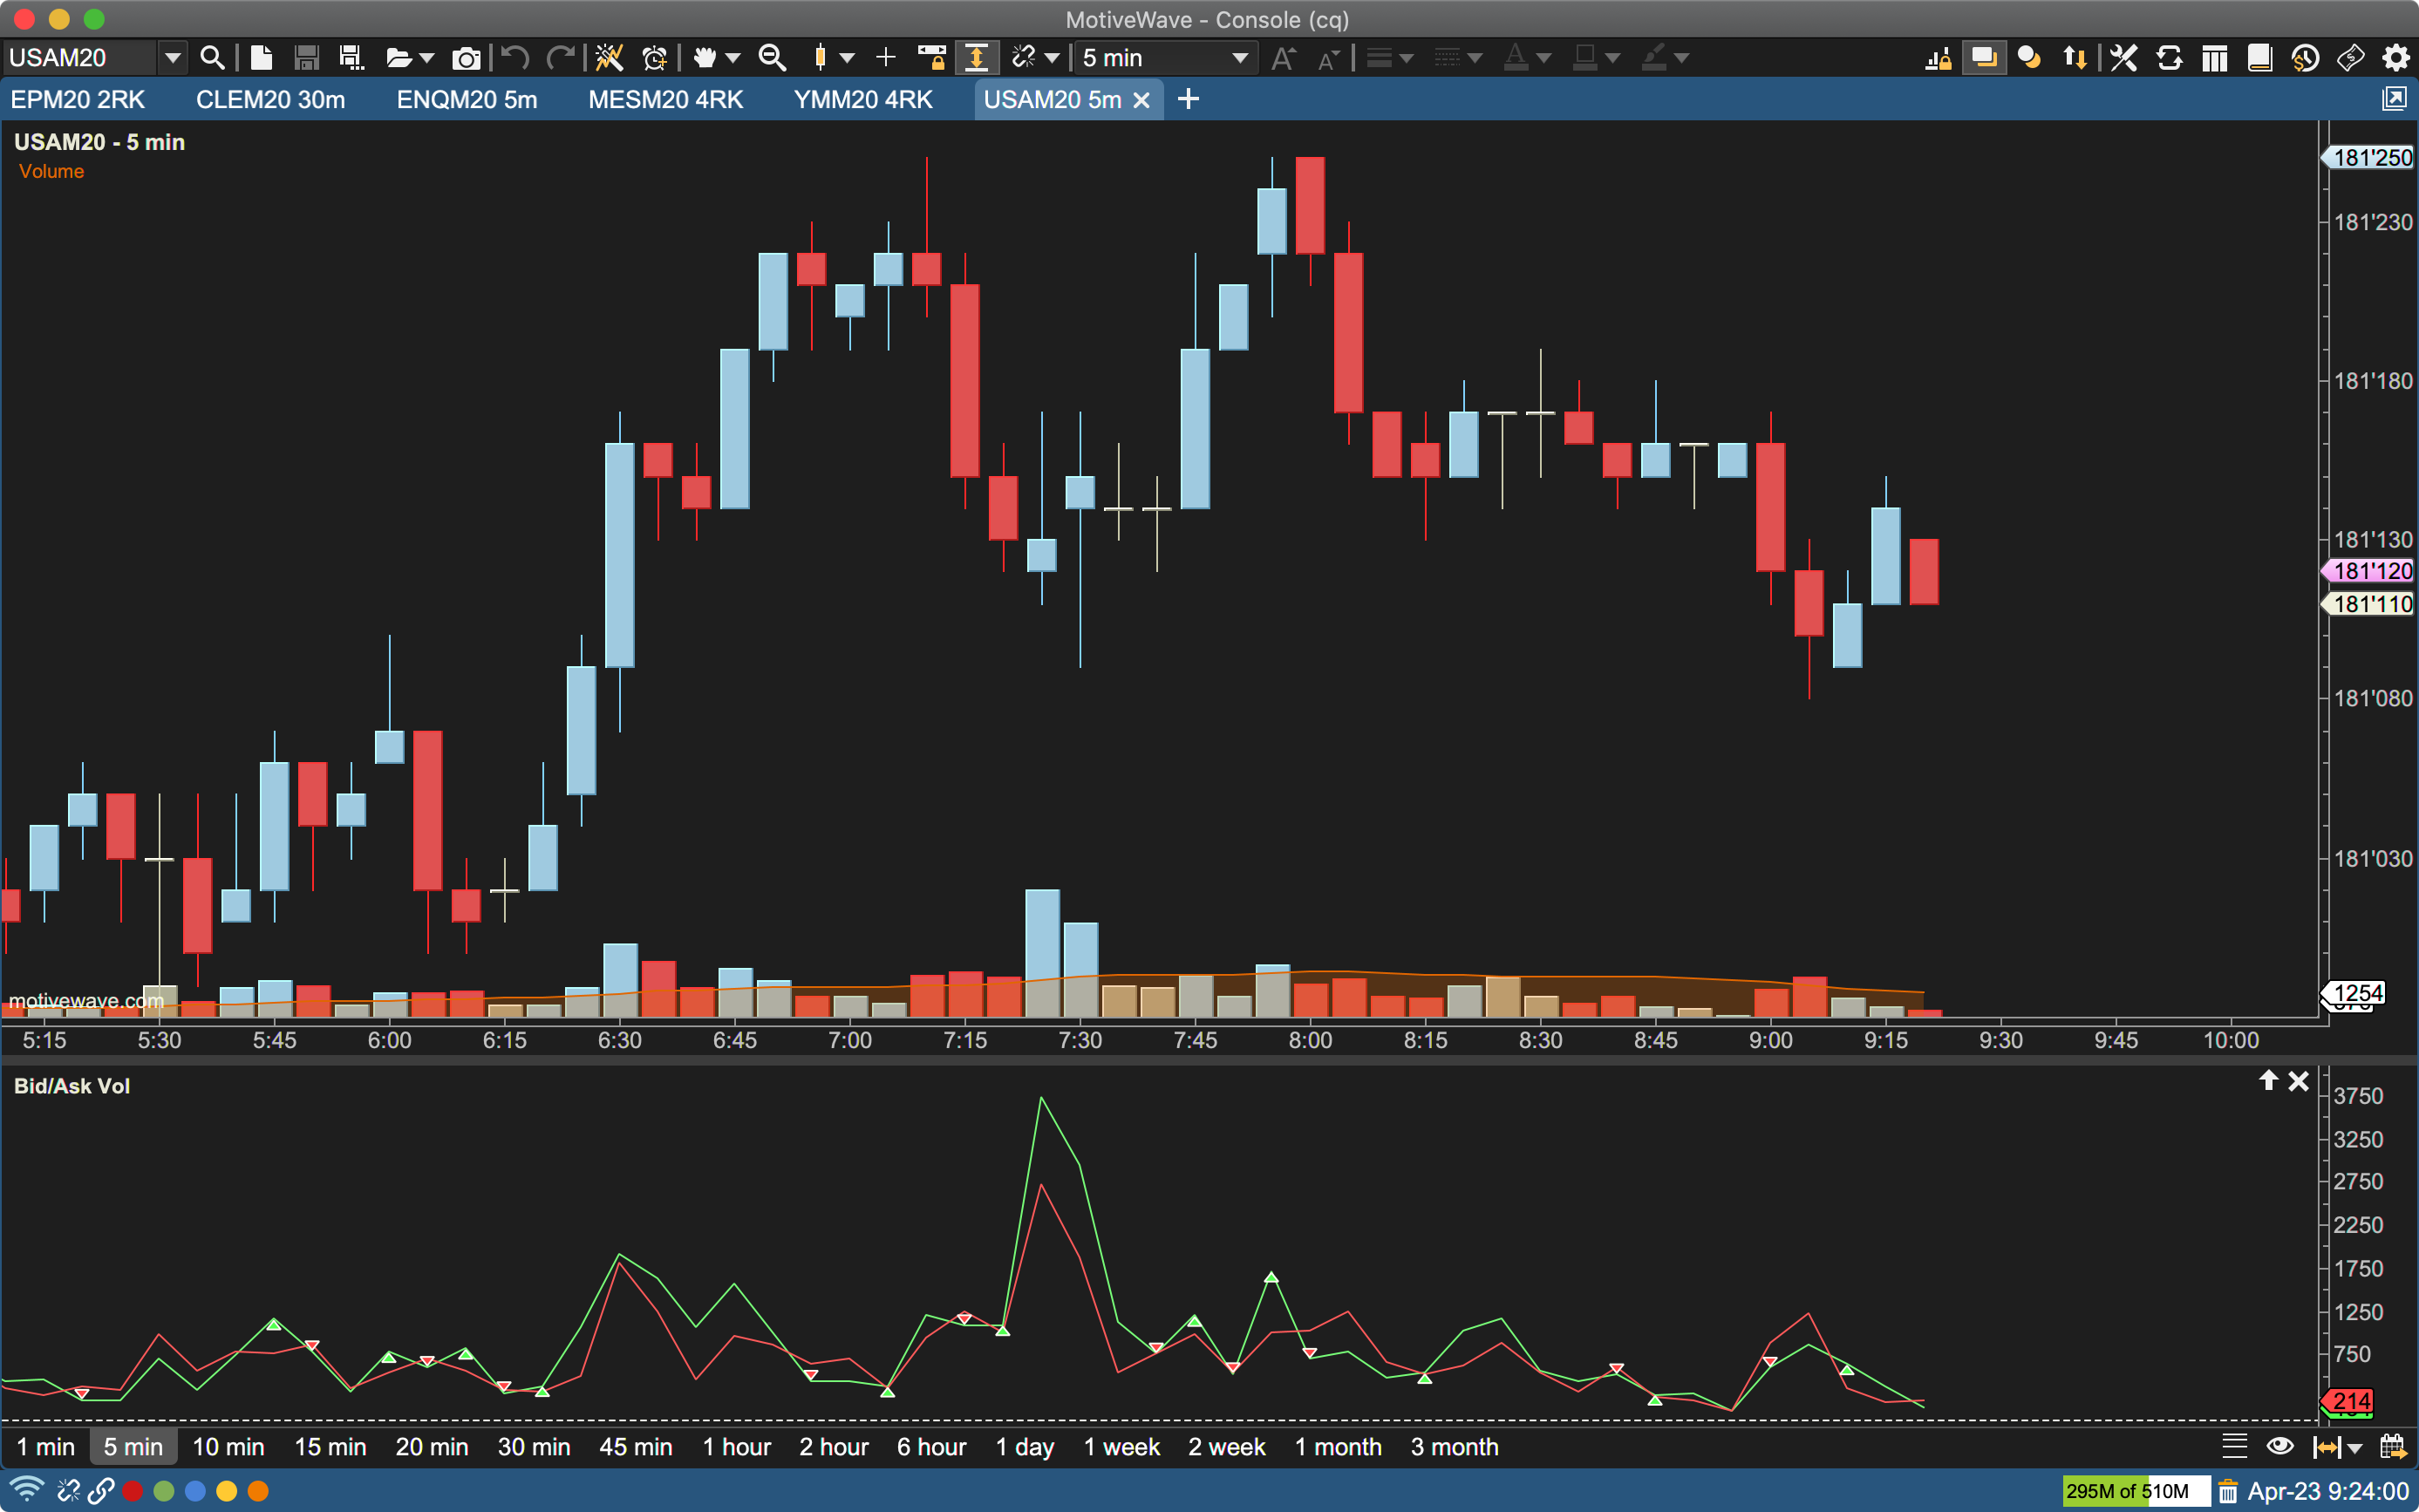
Displays bid volume and ask volume as separate paths. Optionally shows where these paths cross (generating signals). Identify changes from buying pressure to selling pressure.
Delta Volume Study
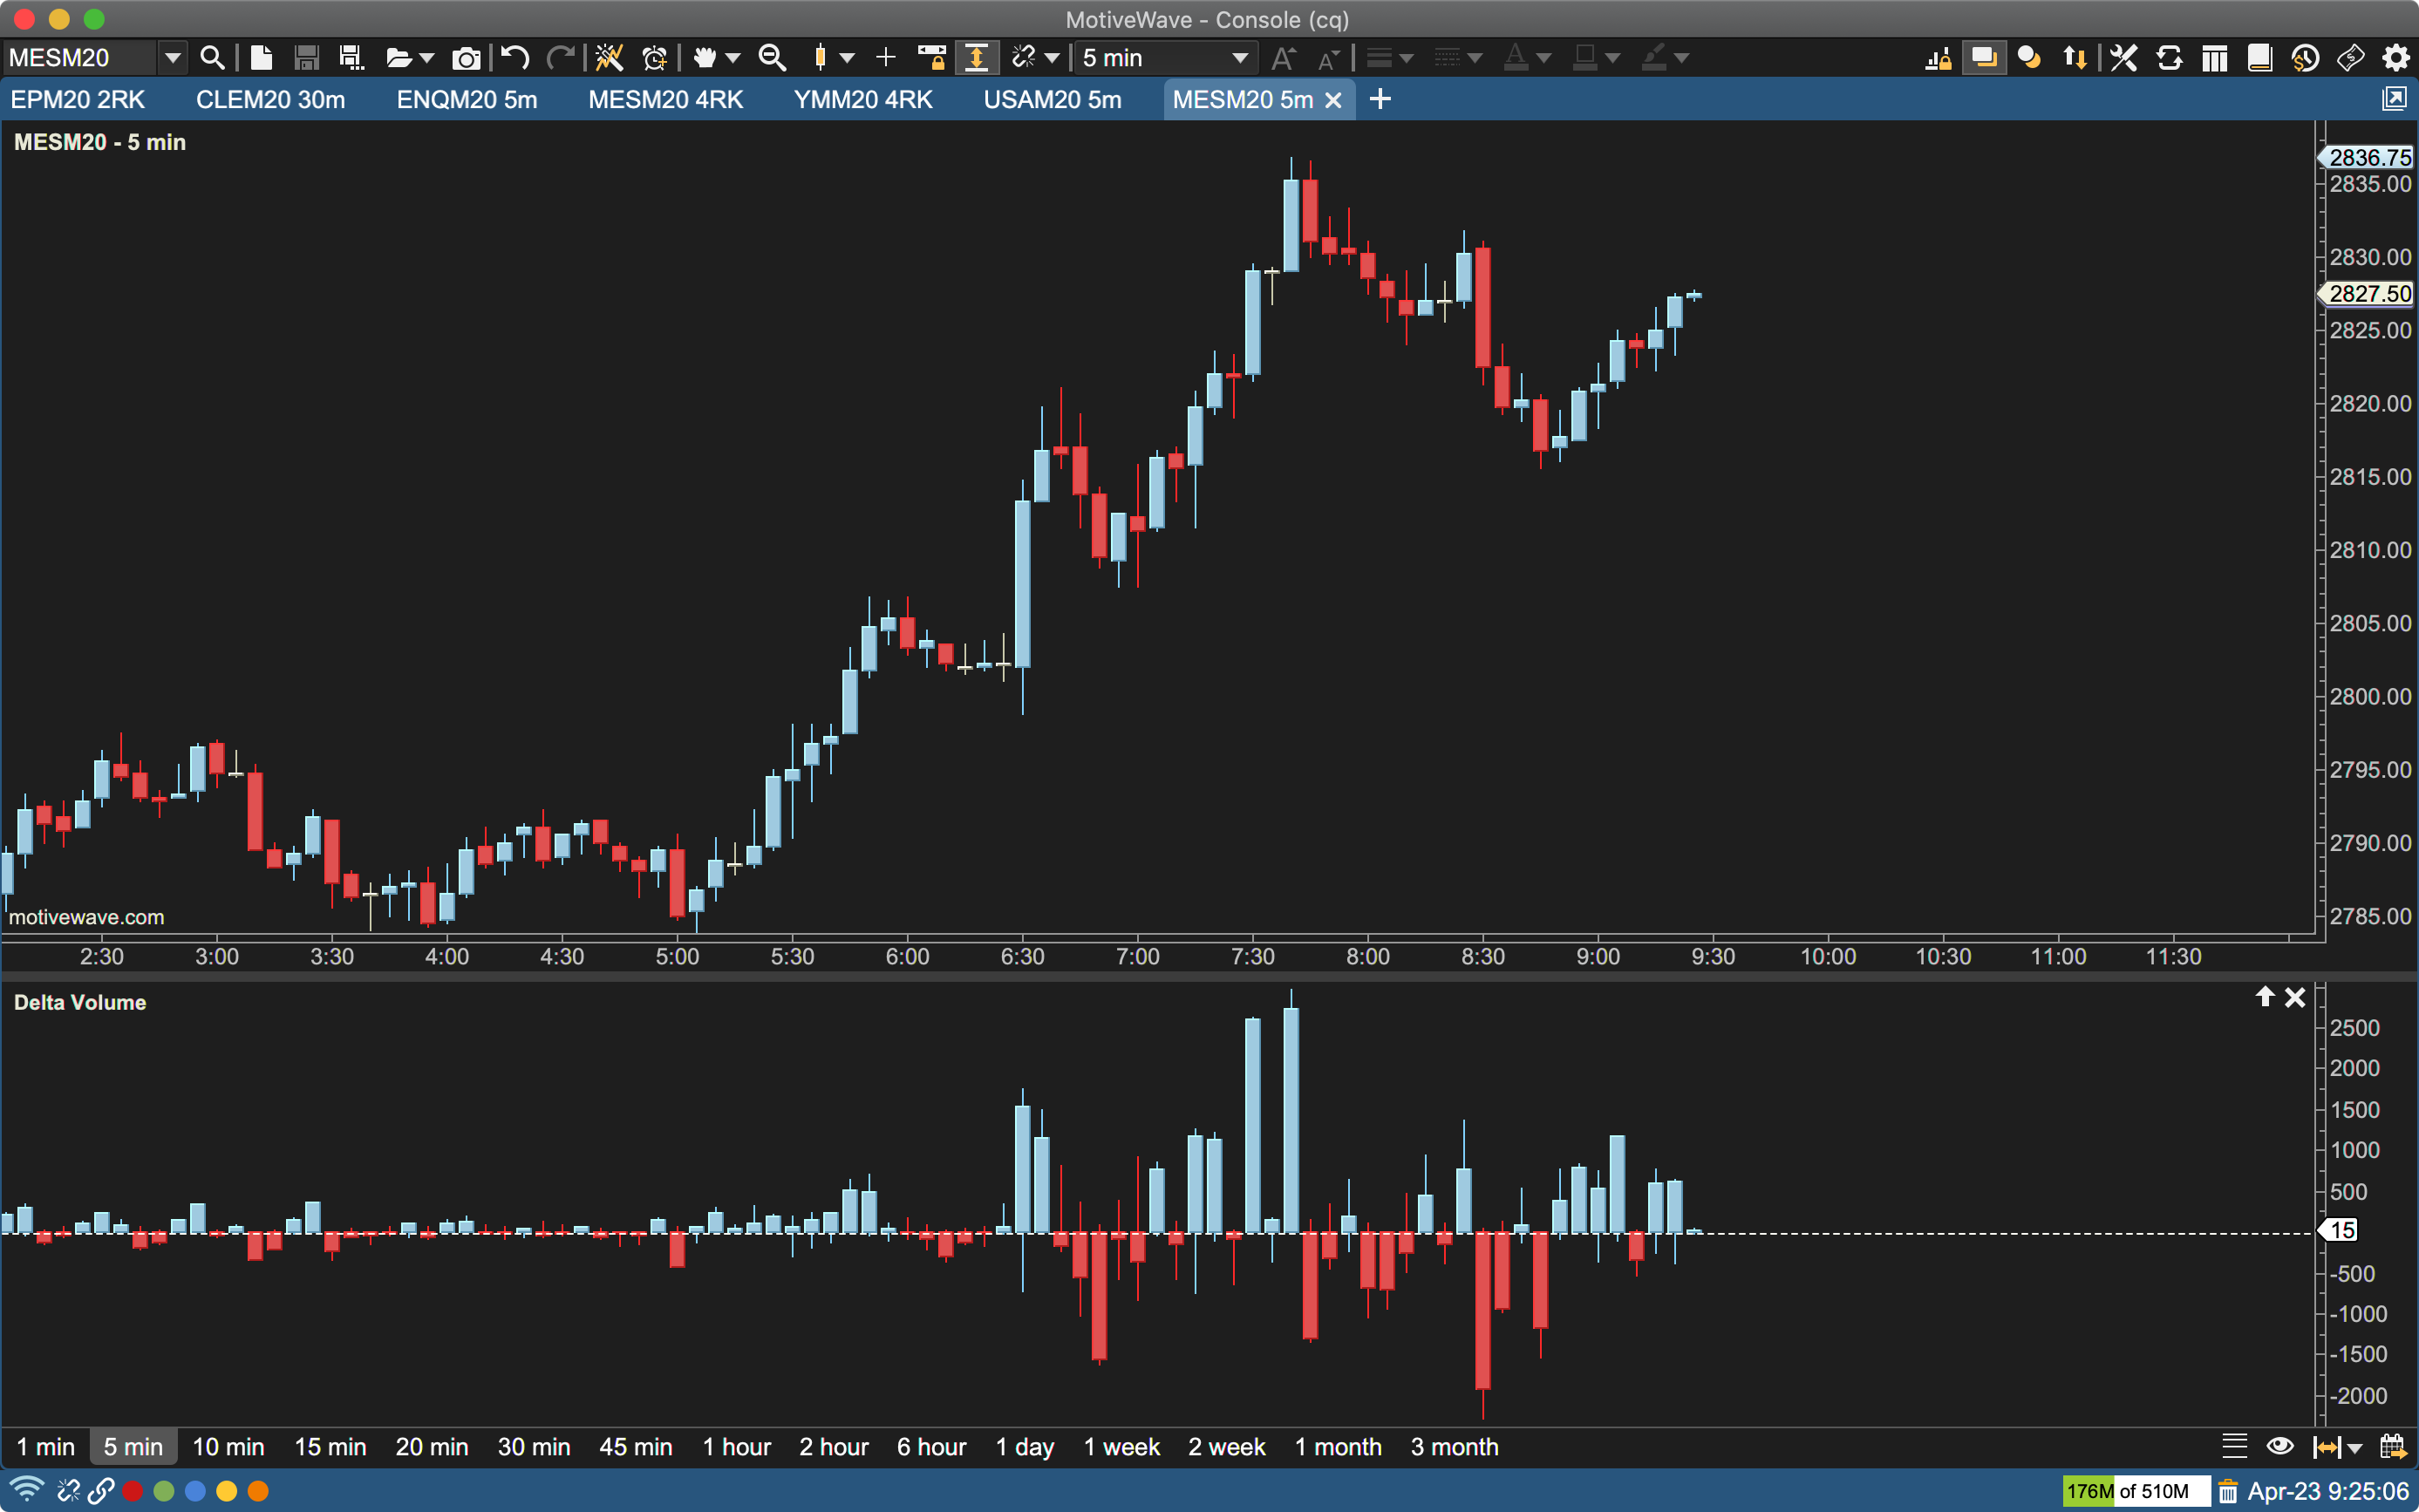
Displays the difference between the Ask and Bid Volume as a candle chart in a separate graph. Positive values indicate buying pressure and negative values indicate selling pressure.
Cumulative Delta Study
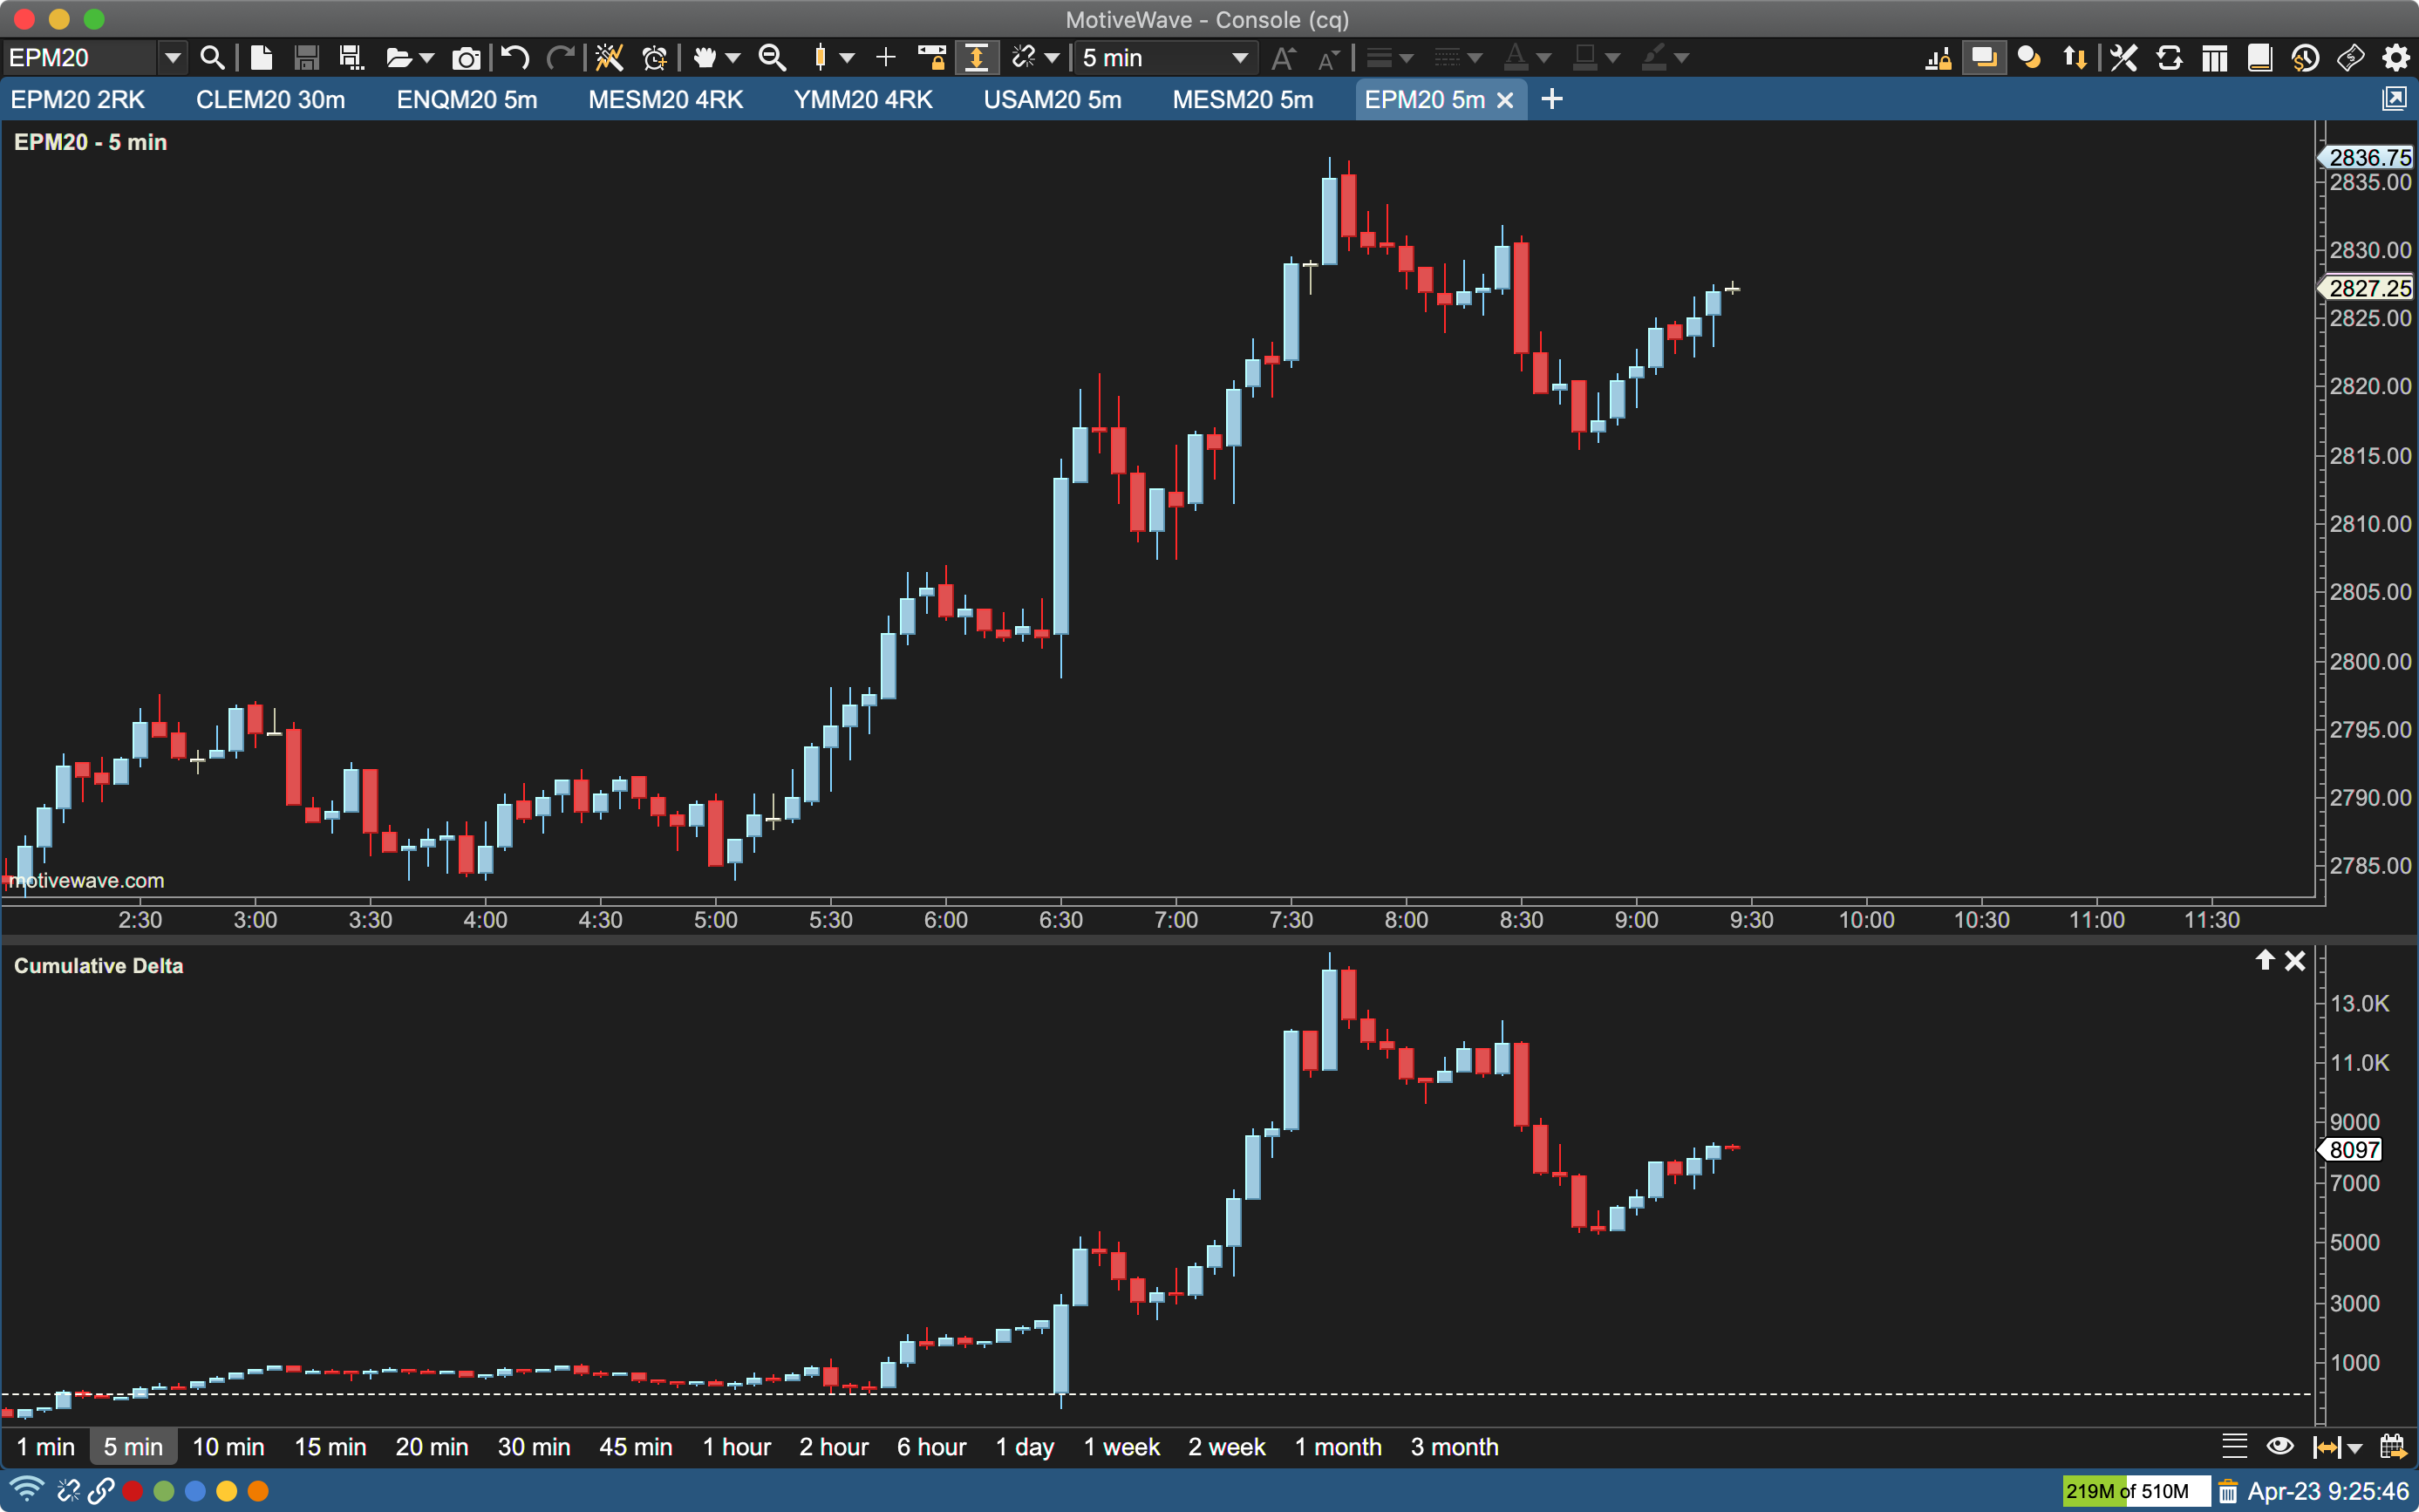
Displays the accumulation of the delta (difference between ask and bid volume), to show you if there are more buyers or sellers at a particular price.
Order Flow Studies Pack
These 11 Studies (all highlighted above) are part of the Order Flow Studies Pack, which is included in our Order Flow, Professional, and Ultimate Editions, and can help you gain an edge when analyzing order flow:
- Bid/Ask Volume
- Big Trades Study
- Cumulative Delta
- Delta Volume
- Depth of Market
- DOM History
- DOM Power
- Speed Gauge
- Speed of Tape
- Time Price Opportunity (TPO)
- Volume Imprint
Additional Volume-Based Studies
MotiveWave has many volume-based studies included in ALL of our editions:
- Accumulation/Distribution Line
- Better Volume
- Daily Volume Profile
- Ease of Movement
- Elastic Volume Weighted MA
- Herrick Payoff Index
- Klinger Volume Oscillator
- Multi Vote OnBalance Volume
- Negative Volume Disparity Indicator
- Negative Volume Index
- On Balance Volume
- OnBalance Volume Disparity Indicator
- Open Interest
- Percentage Volume Oscilltor (PVO)
- Positive Volume Index
- Relative Volume
- TFS Volume Oscillator
- UpSide DnSide Volume
- Volume
- Volume Accum PerCent
- Volume Accumultion Oscillator
- Volume Oscillator
- Volume Price Confirmtion Indicator (VPCI)
- Volume Price Trend
- Volume Profile – shown above
- Volume Rate of Change
- Volume Weighted Average Price (VWAP) – shown above
- Volume Weighted Moving Average (VWMA)
- Volume Zone Oscillator
Please Note: If you are looking for the OFA Modules from Order Flow Analytics, they are not included in the MotiveWave editions and must be purchased separately as an Add-On through orderflowanayltics.com
See More Order Flow Features and Details in the
MotiveWave Online Volume & Order Flow Analysis Guide
MotiveWave Volume & Order Flow Analysis Guide (PDF)
Compare Order Flow Tools in All MotiveWave Editions
Quickly compare which Order Flow tools and studies are in each of our editions below.
…But we’re not just Order Flow software. Click on the ‘See Full List of Edition Features’ link on any edition below to see the full set of features included, and all pricing options.
COMMUNITY
FREE
Order Flow Features:
- Volume Profile and VWAP Studies
STANDARD
$24 /mo
(Lease and Own options available)
Order Flow Features:
- Volume Profile and VWAP Studies
- Basic DOM
POPULAR
ORDER FLOW
$49 /mo
(Lease and Own options available)
Order Flow Features:
- Volume Profile and VWAP Studies
- Advanced DOM
- Time and Sales
- Order Flow Studies Pack
- 2 Extra Volume Profile and TPO Components
PRO
$99 /mo
(Lease and Own options available)
Order Flow Features:
- Volume Profile and VWAP Studies
- Advanced DOM
- Time and Sales
- Order Flow Studies Pack
- 2 Extra Volume Profile and TPO Components
ELLIOTT WAVE
ELLIOTT WAVE LITE
$89 /mo
(Lease and Own options available)
Order Flow Features:
- Volume Profile and VWAP Studies
- Basic DOM
ELLIOTT WAVE
ULTIMATE
$159 /mo
(Lease and Own options available)
Order Flow Features:
- Volume Profile and VWAP Studies
- Advanced DOM
- Time and Sales
- Order Flow Studies Pack
- 2 Extra Volume Profile and TPO Components