T&S appears 100% wrong?

MidKnight

Member
Joined
Aug 3, 2023
Posts
9
Likes
3
Hi folks,

I'm brand new to Motivewave and just conducting the trial (version 6.7.10)

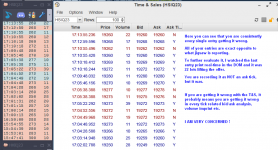
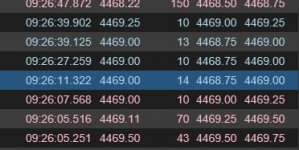
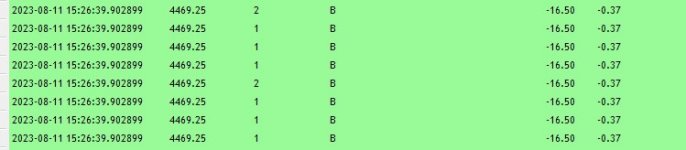
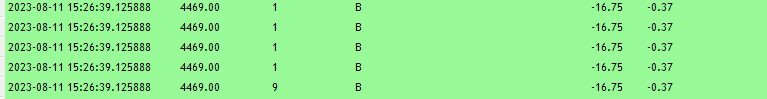
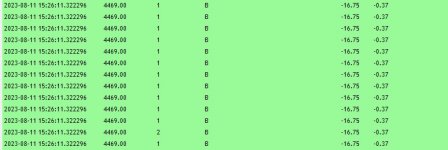
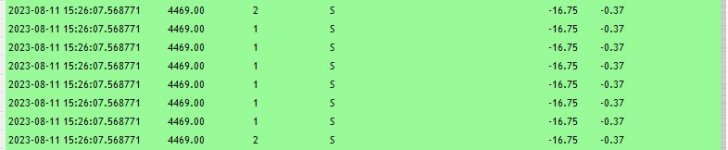
Attached here is a screenshot of a T&S screen from Motivewave compared to Jigsaw trading. Both platforms are using the exact same data feed (CQG) and both platforms were being watched in real-time when I recorded this screenshot. Both T&S are filtering 10 + lots only. You can see that their timestamps and sizes sync up perfectly but their action of trading on the bid or the ask are completely opposite. The very top print being compared I watched in real-time as the 22 lots was lifted on the offer yet MW has assigned it as not an ask tick (which it was) and will show in the T&S that it was no the bid (which it was not). Having watched this in real-time, I conclude that every single entry in that T&S screenshot is assigned wrong and that is why it is 100% opposite to Jigsaw.

I may be new to Motivewave but I'm not new to trading. Suffice it to say that I am extremely alarmed to find this. If the T&S is wrong then there is high potential that all volume related bid/ask analysis within MW is going to be wrong. I'm actually a bit scared to proceed with this free trial as already it seems like this platform evaluation could be a waste of time.

Anyone should be able to check this on their own feeds and products by setting a high enough volume filter so can easily see it trade in real-time compared with the DOM recent trades columns. I'd appreciate anyone else assessing this on their own configuration chiming in.

With kind regards,
MK
 

Attachments

  • MK-2023-08-08_171808.png
    MK-2023-08-08_171808.png
    48.8 KB · Views: 31

igor.s

Well-known member
Joined
May 22, 2019
Posts
289
Likes
153
I suggest to send that information directly to support.

cheers.
 

MidKnight

Member
Joined
Aug 3, 2023
Posts
9
Likes
3
As I suspected, volume related bid/ask analysis indicators are 100% wrong. Take a look at this cumulative delta vs the market - 100% opposite.

I am completely gobsmacked that this basic basic form of analysis is wrong. Where is the quality control? It is so obvious even a glance on a chart would be clear the code is doing it wrong.
 

Attachments

  • MK-2023-08-09_131551.png
    MK-2023-08-09_131551.png
    24.4 KB · Views: 21

MidKnight

Member
Joined
Aug 3, 2023
Posts
9
Likes
3
CQG - its not a datafeed problem, that is why I compared it to jigsaw and watched it real-time to see what volume was being hit/lifted.
 

MrSharky

Well-known member
Joined
Jul 21, 2022
Posts
108
Likes
42
Its definitely alarming if there is no simple explanation to your findings. But divergence in cumulative Delta and price is not uncommon or am I not seeing something here.
 

MidKnight

Member
Joined
Aug 3, 2023
Posts
9
Likes
3
Its definitely alarming if there is no simple explanation to your findings. But divergence in cumulative Delta and price is not uncommon or am I not seeing something here.
It is not normal cumulative delta divergence with price and in fact is nothing to do with the actual intricacies of reading a normal cumulative delta chart. The problem is directly in their code of how they assign a bid tick versus an ask tick.

As can be seen in the original post with the T&S comparison, it is every single tick is being assigned the opposite value...
 

kovacs

Active member
Joined
Nov 7, 2022
Posts
26
Likes
8
I've tested it with Rithmic data, Jigsaw / MotiveWave T&S side by side. You are right, it doesn't always 'get it right'. In my case about 20% of the time T&S color is wrong in MW compared to Jigsaw. Surprisingly when I load the footprint stats both platforms are mainly in sync. Not 100% in sync but mostly.
Example: ES, 3 min chart, delta stats for the last 6 candles:
Jigsaw: 112, -64, 211, 19, 82, -275
MotiveWave: 112, -64, 210, 22, 78, -260
 

nooris

Well-known member
Joined
Jul 30, 2023
Posts
152
Likes
71
I don't use time and sales, but my footprint charts (volume imprint bid ask) match those who use Sierra Chart-Denali.
 

kovacs

Active member
Joined
Nov 7, 2022
Posts
26
Likes
8
I don't use time and sales, but my footprint charts (volume imprint bid ask) match those who use Sierra Chart-Denali.
Do you use the footprint Totals that shows the delta stats at the bottom? I also thought mine matches Jigsaw as it matches 80% of the time. But yesterday when I watched it closely I was shocked to discover that it doesn’t always match it perfectly precisely during RTH. Same applies to T&S. It’s not completely off but it isn’t always precise and in some cases it can make a big difference.
 

nooris

Well-known member
Joined
Jul 30, 2023
Posts
152
Likes
71
Do you use the footprint Totals that shows the delta stats at the bottom? I also thought mine matches Jigsaw as it matches 80% of the time. But yesterday when I watched it closely I was shocked to discover that it doesn’t always match it perfectly precisely during RTH. Same applies to T&S. It’s not completely off but it isn’t always precise and in some cases it can make a big difference.

Well that is worrying. I would interested to know if Jigsaw will have similar numbers to Sierra or will each platform have its own numbers. In which case you wouldn't even be able to tell which is correct. It might even be the case that MotiveWave is the most accurate of the three. This needs to be tested with the same data feed and different platforms. How could such a major flaw go unnoticed for so long? And why isn't anyone from MotiveWave replying to this thread?
 

MidKnight

Member
Joined
Aug 3, 2023
Posts
9
Likes
3
Judging from my T&S and the chart I posted. MW is 100% wrong - every single tick is being assigned opposite in my live account CQG account. It is trivial to notice if you watch the market ticking in real-time, especially during slower conditions in a day.

I think it goes unnoticed because the data is fast and people assume it works. If you setup a T&S screen and filter the trades you can slow down the speed of your data and easily compare if it is matching another platform with the same T&S settings.

I hope MW look into it and get it fixed. Finding this problem early on in my Free Trial of the software has ceased further investigation into this product.
 

nooris

Well-known member
Joined
Jul 30, 2023
Posts
152
Likes
71
Judging from my T&S and the chart I posted. MW is 100% wrong - every single tick is being assigned opposite in my live account CQG account. It is trivial to notice if you watch the market ticking in real-time, especially during slower conditions in a day.

I think it goes unnoticed because the data is fast and people assume it works. If you setup a T&S screen and filter the trades you can slow down the speed of your data and easily compare if it is matching another platform with the same T&S settings.

I hope MW look into it and get it fixed. Finding this problem early on in my Free Trial of the software has ceased further investigation into this product.

Here is one thing to consider. There is a white label version of MotiveWave licensed to Edge Clear called EdgeProX. Edge Clear is owned and run by one of the biggest flow traders and educators around (@futurestrader71) and I think he was a pit trader at the CME. The guy knows his stuff and does tons of videos. I really think he would have caught on to this. I'm attaching pictures that shows his attention to this (including how he sets up his cum delta at bottom).

You might already know him on X (formerly twatter) where he is active. Might be worth redirecting him to this thread.
 

Attachments

  • 2021-07-06_20EdgeProX_Active.png
    2021-07-06_20EdgeProX_Active.png
    323.2 KB · Views: 30
  • 2021-07-06_20EdgeProX_OrderFlow.png
    2021-07-06_20EdgeProX_OrderFlow.png
    437.3 KB · Views: 29

MidKnight

Member
Joined
Aug 3, 2023
Posts
9
Likes
3
Thanks for the input Nooris.

FT71 will be using rithmic not CQG probably because he will want to be able to reconstruct trades. He used to use bookmap for all his tape related work.

I spent some time in Convergent when it began....
 

kovacs

Active member
Joined
Nov 7, 2022
Posts
26
Likes
8
I'm watching the MotiveWave T&S, Jigsaw T&S and Ironbeam's own datafeed's T&S right now.

Currently it is mostly in sync, however for example:
Jigsaw T&S: ESU23 11:01:04 4479.75 18 At Ask
Ironbeam T&S: ES.U23 11:01:04 4479.75 18 At Ask
MotiveWave T&S: ESU3 11:01:04 4479.75 20 At Ask

Apart from this occasional anomaly, the 3 platform's T&S is in currently sync. I will keep observing during RTH.

One other thing I observed is while Jigsaw and Ironbeam T&S speed is 100% the same, MotiveWave often prints it 1 sec slower. I don't even need to record this and re-watch in slow motion, I can see it with my own eyes that MW is often a tiny bit slower than the 2 others.
 

MrSharky

Well-known member
Joined
Jul 21, 2022
Posts
108
Likes
42
This is Motivewave T&S checked against Rithmic Trader Pro. I dont see it beeing wrong, maybe I´m looking at it wrong.
 

Attachments

  • Motivewave 2023-08-11 152944.jpg
    Motivewave 2023-08-11 152944.jpg
    30 KB · Views: 12
  • Rtrader 2023-08-11 153035.jpg
    Rtrader 2023-08-11 153035.jpg
    31.1 KB · Views: 12
  • Rtrader 2023-08-11 153147.jpg
    Rtrader 2023-08-11 153147.jpg
    19.4 KB · Views: 10
  • Rtrader 2023-08-11 153318.jpg
    Rtrader 2023-08-11 153318.jpg
    49.4 KB · Views: 8
  • Rtrader 2023-08-11 153433.jpg
    Rtrader 2023-08-11 153433.jpg
    30.8 KB · Views: 10

kovacs

Active member
Joined
Nov 7, 2022
Posts
26
Likes
8
This is Motivewave T&S checked against Rithmic Trader Pro. I dont see it beeing wrong, maybe I´m looking at it wrong.
On your MW screenshot, please check 09:26:05 and 09:26:47 timestamps. Volume 70 and 150, nice round numbers. Then check the price associated with these rows. Now we know why it is off. (4469.11? 4468.22? wtf?) I discovered the same thing today, was just about to post about this when I saw your post.
 

MrSharky

Well-known member
Joined
Jul 21, 2022
Posts
108
Likes
42
There is a explanation for those numbers, in Rtrader at that timestamp 09:26:05:516 the price was hit at 4469 and 4469,25.

I dont have a screenshot for 09:26:47:872 unfortunately but its probably the same there the price was hit at two different prices.

Actually I do have data for that timestamp as well, the price was hit at 4468.25, 4468.50 and 4468.00 at that timestamp
 
Last edited:

kovacs

Active member
Joined
Nov 7, 2022
Posts
26
Likes
8
Ok, but I've never seen any T&S that prints prices like that. Jigsaw, Ironbeam and I guess literally all other T&S prints quarters for ES, eg 4469.00, 4459.25, 4469.50, 4469.75 etc etc. MotiveWave prints silly in-between prices, eg 4469.11, or what I see in the recent prints: 4466.99, 4466.98, 4467.59, 4473.71 etc etc. This irregular numbers are always associated with a large volume number and it is always a round number. This doesn't show on other T&S like that. If the prices are different we can't expect it to be in sync with Jigsaw or other T&S prints that use quarters only.
 

MrSharky

Well-known member
Joined
Jul 21, 2022
Posts
108
Likes
42
Yes but if you have one large order it will get filled at different prices. It makes full sense that to print that one order it cant be printed at a quarter value.

There is a simple solution for this though, turn of "Aggregate By order" in the T&S of Motivewave settings, and that should solve it.

Also its only a rithmic feature, you will not get it on CQG and other data.
 
Last edited:

kovacs

Active member
Joined
Nov 7, 2022
Posts
26
Likes
8
If there is a large 150 order at 4469.00 and 60 gets filled at 4469.00 and 90 gets filled at 4469.25 , then T&S should show 60 at 4469.00 and 90 at 4469.25 and not 150 at 4469.11
1 tick is 0.25, there is no point in printing fractions of ticks.
 
Top