Spin
Well-known member
- Joined
- May 22, 2019
- Posts
- 509
- Likes
- 216
Hello fellow coders,
Another day and sadly another MW-quirk.
For a client's Study I need Yesterday's High and Yesterday's Low, so I coded them up (using blue horizontal lines to visualize them) and this is the result on a Daily chart:

The Study's log now looks like this:

So far so good !
And then I adjust the barsize, to a value smaller than Daily, and the whole Study starts flipping: the values of Yesterday's High / Low do not even correspond remotely to what they should be (you can tell by the blue lines hovering way too high above the price level):

I have no clue whatsoever as to why this is happening. My Study log still uses the same times as Yesterday's begin and end time, but the values are waaaay higher than they should be.
Has anyone experienced the same behavior, had to fight the same struggle ?
Perhaps this can help: I noticed this piece of code in MW's native PivotPoint-Study:
Could this be the same issue as the one I am facing ?
Thanks in advance for all help !
PS: I started out by trying to use this part of the MW-SDK:
https://www.motivewave.com/sdk/java...ewave.platform.sdk.common.Instrument,boolean)
but I get compilation errors. I believe there is a typo in the SDK-code somewhere, because that method cannot be called
Another day and sadly another MW-quirk.
For a client's Study I need Yesterday's High and Yesterday's Low, so I coded them up (using blue horizontal lines to visualize them) and this is the result on a Daily chart:

The Study's log now looks like this:

So far so good !
And then I adjust the barsize, to a value smaller than Daily, and the whole Study starts flipping: the values of Yesterday's High / Low do not even correspond remotely to what they should be (you can tell by the blue lines hovering way too high above the price level):

I have no clue whatsoever as to why this is happening. My Study log still uses the same times as Yesterday's begin and end time, but the values are waaaay higher than they should be.
Has anyone experienced the same behavior, had to fight the same struggle ?
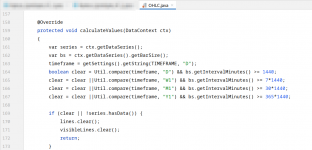
Perhaps this can help: I noticed this piece of code in MW's native PivotPoint-Study:
Java:
if (barSize.isLinear() && barSize.getIntervalMinutes() >= 1440) {
        // This is a bit of a hack.
        // If the trading hours are off by a little bit, its possible that the time from the daily bar
        // is actually on the previous day.  Add a bit of time here to work around
          time = instr.getStartOfDay(time + 6*Util.MILLIS_IN_HOUR, ctx.isRTH());
          if (ctx.isRTH() && time < series2.getStartTime(i) - 6*Util.MILLIS_IN_HOUR) time += Util.MILLIS_IN_DAY;
        end = time + barSize.getSizeMillis(); // Adjust the end here to make sure we have no overlap
      }
Could this be the same issue as the one I am facing ?
Thanks in advance for all help !
PS: I started out by trying to use this part of the MW-SDK:
https://www.motivewave.com/sdk/java...ewave.platform.sdk.common.Instrument,boolean)
but I get compilation errors. I believe there is a typo in the SDK-code somewhere, because that method cannot be called
Last edited:


