elliottwaver.live
New member
- Joined
- Jun 10, 2023
- Posts
- 1
- Likes
- 0
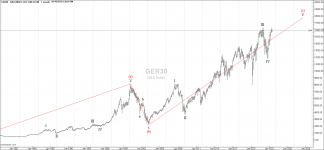
When using the "Auto Analyze" function, it often happens that the entire historical movement is interpreted as an ABC pattern. An example: The data of the DAX index goes back to 1970. There is my zero point. When I apply Auto Analyze, the entire move since 1970 is drawn in shown as one big ABC. This happens with many markets. Is this a software problem or is it possible to change that without manually adjusting the wave count in the settings? Here is a picture of the DAX index where I have partially hidden the subwaves.

