MrSharky
Well-known member
- Joined
- Jul 21, 2022
- Posts
- 197
- Likes
- 83
how to install it in motivewave...can you help ..I like the idea, ill share the two Im currently using. Pretty usefull and straight forward.
Also has previos levels, such as. dOpen,pdLow/high, pWeekHigh/low, pMonthHigh/Low.
Hope it can help someone a i install it in motivvewave
hello sir, im trying to learn and be more familiar with the Delta Footprint , your template provide a lot of info but im confused on how to read it . can you explain how to read it? or you have a video or guide? ThanksI will start of this with a Delta Footprint template for NQ. Just change timeframe and you can use it for other assets.
If you have any questions just ask, I will try to answer them.
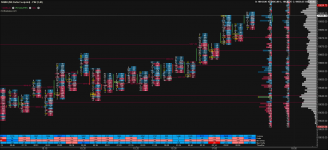
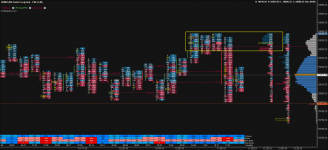
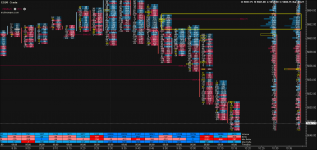
ok, Thanks MrSharky , i will start check and keep my eyes on that , BTW .. the template you post here is not the same as you images , can you pls tell me the setup to get same as the images? or the template? ThanksIn short I'm using my delta footprint to look for absorption at key levels and se if market pushes through or if it gets denied. See the examples below.
On the first one you can see the absorption at 18630-18635 area and the push upwards. On the second there is a massive absorption at 18830-18840, buyers just could not push through this level. So you get a long squeeze and a 30-40 point reversal. And again on the third one same thing at 5661-5663 on ES.
I would be more interested in what your entry criteria are if such an absorption is not broken. Thanks for sharingKurz gesagt, ich nutze meinen Delta-Fußabdruck, um auf Schlüsselebenen nach Absorption zu suchen und zu sehen, ob der Markt sich durchsetzt oder ob er abgelehnt wird. Siehe die Beispiele unten.
Auf dem ersten sieht man die Absorption im Bereich 18630-18635 und den Aufwärtsschub. Auf dem zweiten gibt es eine massive Absorption bei 18830-18840, die Käufer konnten dieses Niveau einfach nicht durchbrechen. Es kommt also zu einem Long Squeeze und einer Umkehr von 30-40 Punkten. Und auf dem dritten wieder dasselbe bei 5661-5663 auf ES.
This is just one aspect of a trading strategy. For actual trade setup you need confluence with maybe something like support/resistance, volume profile/market profile, price action, or what ever else that fits your strategy and your trading style. And finally you need risk management with a define risk and profit target.I would be more interested in what your entry criteria are if such an absorption is not broken. Thanks for sharing
could i ask why do use the value of 1,40 for the point and figure and what would be a good value for ES?I will start of this with a Delta Footprint template for NQ. Just change timeframe and you can use it for other assets.
If you have any questions just ask, I will try to answer them
For ES 1,6 or 1,8 was what I used when I traded ES, I don't anymore. 1,40 for NQ is just what I have found works well with the volatility of the instrument. But the best way is to just test what works for you.could i ask why do use the value of 1,40 for the point and figure and what would be a good value for ES?
Ty for that, ive been watching the charts over the last week and it seems 1,16 displays everything nicelyFor ES 1,6 or 1,8 was what I used when I traded ES, I don't anymore. 1,40 for NQ is just what I have found works well with the volatility of the instrument. But the best way is to just test what works for you.