mikrom
Active member
- Joined
- Dec 14, 2022
- Posts
- 35
- Likes
- 25
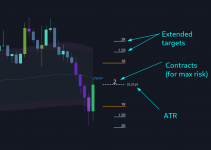
This free study displays SL/TP levels on the chart based on either:
Adjusting size according to the ATR can help you keep your risk consistent regardless of market volatility. Currently, only futures contracts are supported for the size calculation.
I use 1m ATR (10 bars back) for scalping but you can set it to any timeframe and period.


Since the study doesn't know if you intend to short or long, it will display targets on both sides by default. However, this can be changed from quick settings on top of the chart.
ES, NQ, YM, RTY, GC, CL, FDAX.
If you trade a different symbol than these with cross trade on, you will have to set the custom tick value of the micro contract equivalent. For example, ES (MES) has 1.25, NQ (MNQ) has 0.5. You can google specific contract specifications to figure out what value to use.
I will add some new options to this study soon, suggestions are welcome too!
- ATR (Average True Range) with your chosen settings.
- A fixed range value (e.g. 5 points risk and TP levels based on that)
Adjusting size according to the ATR can help you keep your risk consistent regardless of market volatility. Currently, only futures contracts are supported for the size calculation.
I use 1m ATR (10 bars back) for scalping but you can set it to any timeframe and period.


Since the study doesn't know if you intend to short or long, it will display targets on both sides by default. However, this can be changed from quick settings on top of the chart.
Cross trade setting
If you use cross trade in MotiveWave, you might want to enable the Cross Trade option in the study settings so that it calculates the number of micro contracts to use instead of mini contracts. The study already has built-in support for the following symbols if the tick value setting is set to Auto:ES, NQ, YM, RTY, GC, CL, FDAX.
If you trade a different symbol than these with cross trade on, you will have to set the custom tick value of the micro contract equivalent. For example, ES (MES) has 1.25, NQ (MNQ) has 0.5. You can google specific contract specifications to figure out what value to use.
Download here
https://tradingtools.dev/rr-toolI will add some new options to this study soon, suggestions are welcome too!
Last edited:
