Renko candles

elliottwave

Active member
Joined
Apr 27, 2020
Posts
38
Likes
5
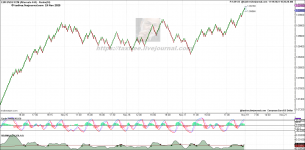
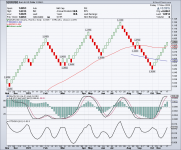
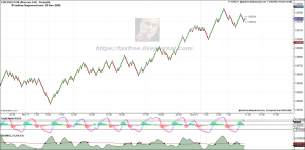
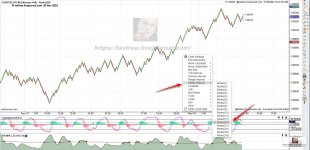
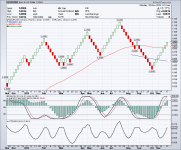
There is a Renko candlestick chart view in Motivewave. But I don't understand how I can select the day timeframe - the Motivewave manual does not explain in detail how to work with Renko candles - in the selection settings there is only a choice of interval in the form of numbers. How can I get a chart with timeframe 1 day but with Renko candlesticks? Such as below, made on stockcharts
 

Attachments

  • EURUSD - Alternate 444 - Nov-19 1036 AM (Renko(34)).png
    EURUSD - Alternate 444 - Nov-19 1036 AM (Renko(34)).png
    125.3 KB · Views: 14
  • sc.png
    sc.png
    70.1 KB · Views: 15

igor.s

Well-known member
Joined
May 22, 2019
Posts
289
Likes
153
The platform only supports Renko bars with a fixed size based on number of ticks. That applies to P&F and Range bars.

cheers.
 

nooris

Well-known member
Joined
Jul 30, 2023
Posts
152
Likes
71
Renko is not time based, and therefore your question doesn't really make sense. If you want your Renko charts to look like the attached charts then set the Renko range similar to them. That's true for any platform. Here's a Renko 20 for EURUSD futures.
 

Attachments

  • EU6Z23 - Untitled - Nov-20 1123 AM (Renko(20)).png
    EU6Z23 - Untitled - Nov-20 1123 AM (Renko(20)).png
    111.7 KB · Views: 4

elliottwave

Active member
Joined
Apr 27, 2020
Posts
38
Likes
5
Renko is not time based, and therefore your question doesn't really make sense. If you want your Renko charts to look like the attached charts then set the Renko range similar to them. That's true for any platform. Here's a Renko 20 for EURUSD futures.
Thanks for answer - could you explain why interval must be 20 ? Chart not similar with Renko 20
 

Attachments

  • EURUSD - Alternate 444 - Nov-20 1026 AM (Renko(20)).png
    EURUSD - Alternate 444 - Nov-20 1026 AM (Renko(20)).png
    123.2 KB · Views: 2
  • ScreenShot19720.jpg
    ScreenShot19720.jpg
    379.1 KB · Views: 2

nooris

Well-known member
Joined
Jul 30, 2023
Posts
152
Likes
71
The example I gave was just to illustrate that by changing the range you can have a multi day chart. The range does not need to be 20, and it's probably different from the instrument I was using and yours ( futures tick in 0.0005 while I think spot ticks in 0.0001 ). The point is play with the range to suit your needs. Also you are not limited to the preset ranges on the right click dialog, if you click on chart settings you can use any Renko range you want.
 

elliottwave

Active member
Joined
Apr 27, 2020
Posts
38
Likes
5
The example I gave was just to illustrate that by changing the range you can have a multi day chart. The range does not need to be 20, and it's probably different from the instrument I was using and yours ( futures tick in 0.0005 while I think spot ticks in 0.0001 ). The point is play with the range to suit your needs. Also you are not limited to the preset ranges on the right click dialog, if you click on chart settings you can use any Renko range you want.
On stockcharts, the chart view represented by Renko candlesticks does not change depending on the time range displayed on the chart. My question was in this regard - can I achieve this in motivewave ? If not, maybe the developers will read this and put it on the list of improvements?
 

Attachments

  • sc.png
    sc.png
    70.5 KB · Views: 2
  • sc1.png
    sc1.png
    109.1 KB · Views: 2

nooris

Well-known member
Joined
Jul 30, 2023
Posts
152
Likes
71
I have never used stock charts, but it seems that your Renko there is based on 14 day ATR. You can't do that on motive wave. You can still achieve something similar by tinkering with the Renko range manually.
 

elliottwave

Active member
Joined
Apr 27, 2020
Posts
38
Likes
5
I have never used stock charts, but it seems that your Renko there is based on 14 day ATR. You can't do that on motive wave. You can still achieve something similar by tinkering with the Renko range manually.
ок. Thank you for explanation
 

igor.s

Well-known member
Joined
May 22, 2019
Posts
289
Likes
153
Some trading platforms offer P&F, Renko charts built from time based data, for example 5m, 15m and etc and use their ATR to calculate the box size. The MW platform does not offer that feature. You can find plenty of discussions within the trading communities which method, fixed vs dynamic, is better. From my personal experience the fixed box size method, implemented by MW, is good.

cheers.
 
Top