You are using an out of date browser. It may not display this or other websites correctly.
You should upgrade or use an alternative browser.
You should upgrade or use an alternative browser.
Multi time frame analysis
- Thread starter Fred R
- Start date
- Joined
- Mar 26, 2019
- Posts
- 222
- Likes
- 71
Hi,
Do you have further details of what you are trying to do? If you want analysis to carry over from one timeframe to the other, then you can used named analyses. Details can be found in the following guide: http://motivewave.com/guides/MotiveWave_Analyses.pdf
Do you have further details of what you are trying to do? If you want analysis to carry over from one timeframe to the other, then you can used named analyses. Details can be found in the following guide: http://motivewave.com/guides/MotiveWave_Analyses.pdf
I've been writing studies that run in 3 timeframes (3 different plots output) and I love it.
One of the example studies gives an approach using calculateValues() -- but that's only if you want something custom that checks and updates based on the various timeframes.
easy solutions:
1) just having multiple charts with their own indicators.
2) under options for the indicator, change the bar size. you can add multiples of indicators with different bar sizes to a single chart
Last edited:
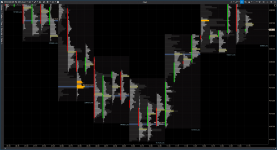
I don't know what OP is referring to but I can give you a visual of what I need as I'm looking to migrate my ATAS charts to MotiveWave. I do multi-timeframe analysis of volume profiles. One on the 15 minute bars, and a second using a 1 hour volume profile. I'm concerned primarily with shape and the overlapping/crossover trends of the lower timeframe POCs with the higher timeframe POCs. I primarily use Market Profile (TPO charts) but use these volume profiles to check the market participation on both half the resolution and double the resolution of a MP chart (30 minute timeframe). Everything about is rather deliberate. The profiles have a static maximum width, with the POC always at the max. All the other bars within that profile then scale off the POC (which is also the max with). They are not relative to prior bars or periods. I also have the values removed since I'm only concerned with prices that have had more than a certain volume. That's what the yellow bars are. Refer to this image from today's session:Hi,
Do you have further details of what you are trying to do? If you want analysis to carry over from one timeframe to the other, then you can used named analyses. Details can be found in the following guide: http://motivewave.com/guides/MotiveWave_Analyses.pdf