Hello,
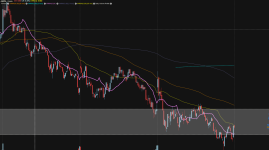
I need some help with adding MA from other time frames but for them to print as array.
For example: 5 min chart has 5 min, 10 min, 15 min, 30 min MA.
How do I get the moving avg to be printed in a straight line until the next cande close of that following time frame? So it would not use the real time updates/
Thanks in advance,

