Lines on chart

Omegaknight

Well-known member
Joined
May 22, 2019
Posts
51
Likes
36
Lets say I wanted to plot down 30 lines on a chart all at different prices. What is the easiest way to do that? I have only thought of putting down one line, then copy/paste it tons of times and change the values of the lines one by one. Is that the only way?
 

igor.s

Well-known member
Joined
May 22, 2019
Posts
278
Likes
150
if you are looking to automate this process than the SDK is a way to go. It supports drawing all kinda elements on the chart.
 

Spin

Well-known member
Joined
May 22, 2019
Posts
474
Likes
189
I agree with igor.s. This is exactly what the SDK is there for.

One 'hack' might be to create a 'Fibonacci retracement' (or Fibonacci Extension) preset with all the lines, but you can only use percentages of the total Fib retracement length. So this will only work if your lines are at fixed intervals from one another.
Also: maximum number of lines there is only 27.:cautious:

So yes: SDK is the way to go :)
 

abctrading

Well-known member
Joined
May 22, 2019
Posts
59
Likes
28
@Omegaknight - I would like to see this feature as well and have also suggested it in a previous post.

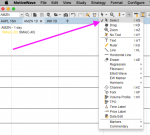
My work around right now since I have no idea how to use the SDK is that I created a few "Custom Tools" using Line Tools and and Price Labels. I then added them to my upper Tool Bar and for even quicker access I created shortcuts for each one.


Tool_Bar_-_Shortcuts.png
 

Spin

Well-known member
Joined
May 22, 2019
Posts
474
Likes
189
I must say @abctrading: that looks neat ! And we all know clean charts make for clean profits (y)


@Omegaknight: You could probably cook up something similar, but I will just drop the link to the SDK Programming guide here, should you ever feel the need to flip through it :)

SDK Programming Guide

The SDK can be cumbersome at times, but quite straightforward to program 'simpler things', like these.
The last option would of course be to contact someone who can program this for you.
 

rctrader

Member
Joined
Jan 8, 2020
Posts
22
Likes
14
Lets say I wanted to plot down 30 lines on a chart all at different prices. What is the easiest way to do that? I have only thought of putting down one line, then copy/paste it tons of times and change the values of the lines one by one. Is that the only way?

On a mac you can draw the first line. Then push and hold down the command key. While holding down the Command Key grab the line you just drew, by holding the mouse button down. So now, while the command key and mouse button are both being pushed down, drag your mouse away from the line. It will create a copy of the line. Let go of the mouse button and then let go of the command button. Bam! You can make copies of lines, text, etc extremely quickly and easily in this way.

I am sure there is a very similar method on the pc. I just don't know what key is equal to the command key on a pc.
 

MotiveWave_Joe

Moderator
Staff member
Joined
Mar 26, 2019
Posts
223
Likes
67
Once you have the Select tool selected in the toolbar, you can hold down the ctrl (cmd on Mac) key and left click the mouse to draw a horizontal line at your specified price point. While still keeping the key still pressed, continue on to your next price level and left click the mouse again. Repeat this process until you have all your lines drawn. To drop multiple vertical lines, you can use the same process but in this case, you can hold down the ctrl + alt (cmd + alt on Mac) keys while clicking the left mouse button. As mentioned above, if you have specific logic regarding the placement of lines, then the easiest way would be to do it would be via a custom study using our SDK.

lines.png
 
Top