I'm a developer experimenting with the motivewave sdk. In particular, I'm trying to build Studies that have access to multiple timeframes (BarSize)s at the same time.
I've noticed an issue with the way that MotiveWave handles data alignment when there are multiple timeframes shown on the same chart.
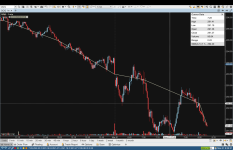
As a simple example, I've created a 1min OHLC chart of QQQ, and then added an SMA(C,1) with its Options/BarSize set to 1 Hour. I know this is a contrived example because 1 period SMA isn't useful, but it's helpful to illustrate the issue.
Using this setup, the SMA takes 60 minutes (or 60 bars of 1min spacing on the chart) in order to calculate its value. So to be clear, the value of the SMA at 8:00am on the 1 min bar chart will be based on data only available at 8:00am and not a minute before.
If I open the CursorData window and scrub through the 1min chart between 7:00am and 8:00am, I can see the SMA(C,1) value is the one that is calculated at 8:00am. This means that MotiveWave is making the 8:00am data available in the chart available in the hour prior! Unless I'm misunderstanding something fundamentally about how MotiveWave deals with aligning multiple time frames, this is a major future leak issue - looking at charts, one could be fooled into thinking that the indicator values have more predictive power than they actually do because the data is leaking from the 'future'.
In addition to the future leak that is evident in the Cursor Data box, the actual SMA(C,1) plot overlay on the 1 min chart is leaking future data too, but in a different way - visually, the SMA is plotted as a straight line between each 60 minute period. So, for example, if you look half way between any 60 minute period, the SMA is already trending towards a 'future' value which should not be known at that point. The plot of a larger time frame indicator on a smaller time frame chart rather should look like a stair step, where the indicator holds it's value flat until it calculates a new one. So, in the case of the SMA(C,1) using 60 minutes, it should have the same value for 60 1 minute bars, until it has calculated a new value, in which case it should jump (or stair-step) up/down to the new value.
Because of this time alignment issue, I'm unable to use MotiveWave at all for any studies or strategies that rely on simultaneous multiple timeframes on a single chart.
Hopefully, I've just misunderstood MotiveWave's approach, but if not, I hope a fix can be provided soon.

I've noticed an issue with the way that MotiveWave handles data alignment when there are multiple timeframes shown on the same chart.
As a simple example, I've created a 1min OHLC chart of QQQ, and then added an SMA(C,1) with its Options/BarSize set to 1 Hour. I know this is a contrived example because 1 period SMA isn't useful, but it's helpful to illustrate the issue.
Using this setup, the SMA takes 60 minutes (or 60 bars of 1min spacing on the chart) in order to calculate its value. So to be clear, the value of the SMA at 8:00am on the 1 min bar chart will be based on data only available at 8:00am and not a minute before.
If I open the CursorData window and scrub through the 1min chart between 7:00am and 8:00am, I can see the SMA(C,1) value is the one that is calculated at 8:00am. This means that MotiveWave is making the 8:00am data available in the chart available in the hour prior! Unless I'm misunderstanding something fundamentally about how MotiveWave deals with aligning multiple time frames, this is a major future leak issue - looking at charts, one could be fooled into thinking that the indicator values have more predictive power than they actually do because the data is leaking from the 'future'.
In addition to the future leak that is evident in the Cursor Data box, the actual SMA(C,1) plot overlay on the 1 min chart is leaking future data too, but in a different way - visually, the SMA is plotted as a straight line between each 60 minute period. So, for example, if you look half way between any 60 minute period, the SMA is already trending towards a 'future' value which should not be known at that point. The plot of a larger time frame indicator on a smaller time frame chart rather should look like a stair step, where the indicator holds it's value flat until it calculates a new one. So, in the case of the SMA(C,1) using 60 minutes, it should have the same value for 60 1 minute bars, until it has calculated a new value, in which case it should jump (or stair-step) up/down to the new value.
Because of this time alignment issue, I'm unable to use MotiveWave at all for any studies or strategies that rely on simultaneous multiple timeframes on a single chart.
Hopefully, I've just misunderstood MotiveWave's approach, but if not, I hope a fix can be provided soon.