Inverted Chart?

Kbs123

Well-known member
Joined
Jul 27, 2021
Posts
62
Likes
8
Anyone know how we can invert the chart? For example, I like to see downtrend inverted as uptrend to better digest the overall price action. This can be done on sierrachart.
 

moe

Active member
Joined
Oct 3, 2021
Posts
29
Likes
6
go addstudy.......then.... instrument ........then instrument overlay ..then inverted ....you can have a mirror of same instrumnt but it is in grey only...if you do not want original one make it hide by choosing no bar
 

Kbs123

Well-known member
Joined
Jul 27, 2021
Posts
62
Likes
8
Got it to
go addstudy.......then.... instrument ........then instrument overlay ..then inverted ....you can have a mirror of same instrumnt but it is in grey only...if you do not want original one make it hide by choosing no bar
Got it to work! But i noticed it doesnt show the wicks of the candlesticks, do you know if there's a way to fix that?
 

moe

Active member
Joined
Oct 3, 2021
Posts
29
Likes
6
it shows for me ,,,,,when you open the window you have the option to choose the bar type too like candle or ...if you choose trend candle that will show you bear and bull candle in different colour with shadow of it
 

Kbs123

Well-known member
Joined
Jul 27, 2021
Posts
62
Likes
8
it shows for me ,,,,,when you open the window you have the option to choose the bar type too like candle or ...if you choose trend candle that will show you bear and bull candle in different colour with shadow of it
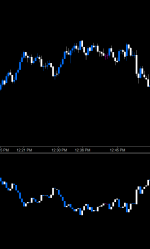
That's weird... i attached a photo of how mine currently looks, bottom is the inverse, top is normal chart. It is in tick chart. Your inverse shows all the wicks?
 

Attachments

  • Screenshot 2023-06-17 184855.png
    Screenshot 2023-06-17 184855.png
    9.5 KB · Views: 13

moe

Active member
Joined
Oct 3, 2021
Posts
29
Likes
6
sorry i am late but i can not find out why the wicks are not showing in yours ...i did tried all and it is showing the wicks ...
 

Kbs123

Well-known member
Joined
Jul 27, 2021
Posts
62
Likes
8
all good. can you show me a screenshot of how your inverted chart looks like?
 
Top