williamiananderson@gmail.
Member
- Joined
- Jul 31, 2023
- Posts
- 19
- Likes
- 3
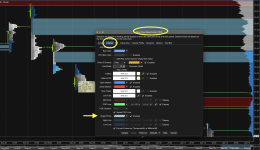
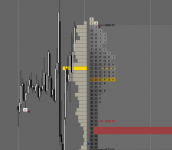
thanks so much, i did that. can you show me an example on your chart? i still dont see any on mine?Best answered in picture form. Other good settings on this page.
thanks so much, i did that. can you show me an example on your chart? i still dont see any on mine?
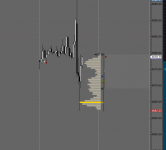
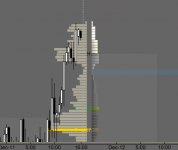
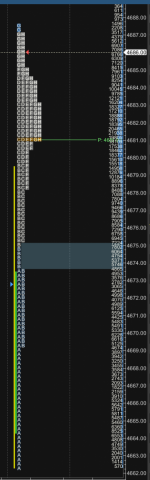
also how come my TPO looks differnt than yours?