How to ensure one histogram appears on top of other histogram?

MrHwang

Member
Joined
Apr 9, 2021
Posts
15
Likes
16
I'm writing an indicator with two histograms, one is visually on top of the other. The "back" histogram has a width of 4, the "front" histogram has a width of 2.

How do I ensure, programmatically, that the "front" histogram always appears on top of the "back" histogram?

In my testing, it seems that one or the other appears on top randomly. I'm not sure what is affecting which appears on top. I figure there is something I am missing in the initialize() function. The histograms appear in a single subpanel (subgraph?) below the price graph.

Essentially, something like this:
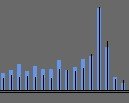
Screenshot_2.jpg

Thanks for the help.

...also, why are histograms called bars?
 
Last edited:

Spin

Well-known member
Joined
May 22, 2019
Posts
477
Likes
191
I know you can 'background' a Study, so the other studies and your price plot (bars, line, candle sticks, Heiken Ashi, ...) appear on top of it. This is called 'underlay' in the SDK overview:

https://www.motivewave.com/sdk/java...dk/study/StudyHeader.html#underlayByDefault()

Every Study has the option by default in its 'options' menu. The code above is just used to tick this box by default.

772

This does not, of course, solve your problem, because you are looking for a 'hierarchy' WITHIN a Study, not BETWEEN different studies.


Perhaps 'addFigureFront' can help ?

https://www.motivewave.com/sdk/java...ront(com.motivewave.platform.sdk.draw.Figure)

FYI: I did a quick search in the 275+ standard MW-studies, but it seems 'addFigureFront' is not used anywhere. So it's up to your tinkering to find out what exactly it does :)

You could add the second histogram to a separate Study, and 'underlay' that one, as a workaround, but I admit it's not a pretty solution
 

MrHwang

Member
Joined
Apr 9, 2021
Posts
15
Likes
16
Thank you @Spin for helping me out and everything you post here regarding the SDK. I will check out addFigureFront() function.

I *think* I solved the problem with the order in which I added the BarDescriptor objects to the SettingsGroup object in the code.

To better explain, I first create a SettingsDescriptor object, to which I "add" a SettingTab object by calling .addTab(), to which I "add" a SettingGroup object by calling .addGroup(). Finally, I add a BarDescriptor object to the SettingGroup object by calling .addRow() from the SettingGroup object--I add one BarDescriptor object for each historgram (or two total). I beleive the order in which the BarDescriptor objects were added to the SettingGroup object determined their visual placement. But I could be wrong.

If this is not true, it could also have to do with the order I called the .declareBars() function from the RunDescriptor object. I have to call .declarBars() for each of the two histograms. And if it wasn't that, it might be the combination of all of it. Not sure exactly.

I copied my initialize() function code below to maybe help with what I'm talking about.

Java:
    @Override
    public void initialize(Defaults defaults) {
        var sd = createSD();
        var tab = sd.addTab("General");

        // Quick Settings (Tool Bar and Popup Editor)
        sd.addQuickSettings(new SliderDescriptor(Input_LookbackDays, "Lookback Days", 11, 1, 45, true));
        sd.addQuickSettings(ACT_VOL_PATH);
        sd.addQuickSettings(AVG_VOL_PATH);

        var groupInputs = tab.addGroup("Inputs");
        groupInputs.addRow(new IntegerDescriptor(Input_LookbackDays, "Lookback Days", 11, 1, 45, 1));
      
        /// SPIN, this is the code I'm chiefly referring to; the order in which .addRow() function is called seemed to make the difference.
        var groupHistograms = tab.addGroup("Histograms");
        BarDescriptor averageVolumeHistogram = new BarDescriptor(AVG_VOL_PATH, "Average Volume Histogram", new Color(180, 180, 180, 255), 2, true, true);
        groupHistograms.addRow(averageVolumeHistogram);
        BarDescriptor actualVolumeHistogram = new BarDescriptor(ACT_VOL_PATH, "Actual Volume Histogram", new Color(100, 149, 237, 120), 4, true, true);
        groupHistograms.addRow(actualVolumeHistogram);

        /// Runtime Descriptor
        var desc = createRD();
        desc.setLabelSettings(Input_LookbackDays);
        desc.setTopInsetPixels(10);
        desc.setFixedBottomValue(0);
        desc.setBottomInsetPixels(0);
        desc.declareBars(Values.ACTUAL_VOLUME, ACT_VOL_PATH);
        desc.declareBars(Values.AVERAGE_VOLUME, AVG_VOL_PATH);
        desc.exportValue(new ValueDescriptor(Values.ACTUAL_VOLUME, "Volume", null));
        desc.exportValue(new ValueDescriptor(Values.AVERAGE_VOLUME, "AvgVol", new String[]{Input_LookbackDays}));
        desc.setRangeKeys(Values.ACTUAL_VOLUME, Values.AVERAGE_VOLUME);
    }

I really don't like how histograms are called "Bars", seems very odd to me. A histogram is not a bar graph.
 
Top