trustingturtle
Member
- Joined
- Sep 14, 2023
- Posts
- 12
- Likes
- 3
Hello! After reading through the user documentation, as well as every post on this forum I could find, I'm left with some questions.
First, as I understand it from its intended operation:
Support and resistance lines in the volume imprint strategy are formed by:
My questions are:
If you made it this far, really appreciate the help
First, as I understand it from its intended operation:
Support and resistance lines in the volume imprint strategy are formed by:
- Finding a level of imbalance
- Measuring if it meets the criteria of absorption, as defined in the settings.
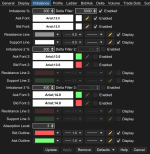
- (Which is odd, considering that field "Absorption Level" is disabled even if support/resistance lines are enabled. Additionally this is not stated in the documentation, just to note for document writers. It only says "Optionally draws support and resistance lines for the first imbalance level."
- Only drawn if the price does not move through it in the next candle
My questions are:
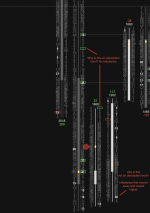
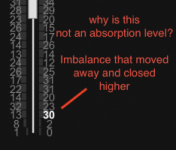
- Why do some levels of no imbalance, still get highlighted as absorption levels?
- Am I missing anything in regards to how the support/resistance lines are actually formed? I'm generally familiar with stacked imbalances, but I'm not seeing any relation to stacked imbalances (subsequent, usually 3, imbalances next to each other) in how these lines form. So want to confirm I'm not missing anything here.
- After I've analyzed more, I'm wondering if you can still get an absorption level, that meets the qualifications of an imbalance %, but does NOT pass the delta filter, in which case it renders as an absorption level (green outline) but not an imbalance level (bold white text), at which point, a support/resistance line is not drawn. If this is the case, which from what I gather it seems to be, it's all very confusing how these things interact with each other and may be a note to improve the settings.
If you made it this far, really appreciate the help


