Coming from NT8, one thing I'm missing is adding a column to a watch list that contains 1 or more values from a study.
I use to have a stop size indicator that gave my monetair risk on that chart and had this always open on my watchlist when I was still using NT8.
So with a blink of an eye I could see what charts where to volatile to trade for my account and which where fine.
(stop size indicator is based on Max(ATR(200), ATR(55)) and then calculate monetary risk from the amount of ticks the stop should be)
The indicator I have almost finished (I'll post it on the forum when done) But still puzzled how to get a column in the Watchlist that contains the value of my indicator ?
(Using the commercial orderflow version now, upgrading to the Pro when Cyber Monday hits the pricing table")
Expected behaviour/feature request?:
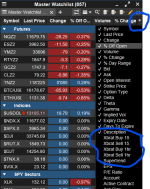
Watchlist -> Add Column -> Add Indicator
- > Select Indicator + time frame etc
-> Select which plot line value to use as column value
Any help hints appreciated
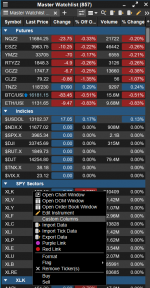
Example:
This is the indicator that outputs two plots. One the stop in ticks and one that gives the monetary risk. I add two columns to the watchlist and use in eacht column a different value of the indicator output. Here is an example from another traders software:

I use to have a stop size indicator that gave my monetair risk on that chart and had this always open on my watchlist when I was still using NT8.
So with a blink of an eye I could see what charts where to volatile to trade for my account and which where fine.
(stop size indicator is based on Max(ATR(200), ATR(55)) and then calculate monetary risk from the amount of ticks the stop should be)
The indicator I have almost finished (I'll post it on the forum when done) But still puzzled how to get a column in the Watchlist that contains the value of my indicator ?
(Using the commercial orderflow version now, upgrading to the Pro when Cyber Monday hits the pricing table
Expected behaviour/feature request?:
Watchlist -> Add Column -> Add Indicator
- > Select Indicator + time frame etc
-> Select which plot line value to use as column value
Any help hints appreciated
Example:
This is the indicator that outputs two plots. One the stop in ticks and one that gives the monetary risk. I add two columns to the watchlist and use in eacht column a different value of the indicator output. Here is an example from another traders software:
Last edited: