Price guides / lines across charts of same instrument

erp

Member
Joined
May 26, 2023
Posts
16
Likes
9
Would like to bump this thread https://support.motivewave.com/foru...ent-charts-for-same-instrument.301/#post-3152

Perhaps there is a way to do this, but I have not figured it out yet. I realize I can adjust drawing visibility on time frames on the same chart, but would like to be able to create a price guide or line on one /ES (as an example) chart and have it appear on other /ES charts (or not) on different pages, desktops, etc.

Thanks for any advice on how to solve this, or if there is not a solution currently, would love to see it in a new release.
 

Donovan2580

Well-known member
Joined
Sep 13, 2020
Posts
435
Likes
237
If you save a chart as an "Analysis" you can open more than one instance of it with different time frames.

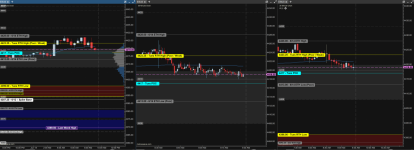
For example: In the screenshot below - this particular analysis I have called "30 Minute". At the end of the day I mark up my charts with lines, price guides, etc. on the 30 minute chart. During the trading session I have this screen open showing a 30 min, 1 minute & 5 minute chart with all the "stuff" on it.
If I want to draw a circle, arrow, etc on the 5 minute chart and not have it visible on the others I just handle that by using the visibility function.

Notice on the upper left of each chart that each it says "30 minute chart" - That is the "Analysis" running across all 3 charts even though they are different time frames.

On a side note: Once I figured it out - these analysis' can help everything stay very organized. For example I have about 15 charts loaded that all fall under the sub-category of 3 tabs (See below)

Does that help at all? :)

1.png


1686750094197.png
 
Last edited:

erp

Member
Joined
May 26, 2023
Posts
16
Likes
9
Thanks for the reply. It might. I'm still trying to master the analysis function, but if the charts I use are say a combination of a candlestick, footprint and TPO (different time frames), does the analysis work for that?

To be more clear, say I have a RTH daily TPO I look at end of day, and maybe a high time frame candlestick, and then during the day I have a lower time frame candlestick for execution and also a lower time frame footprint as the two charts. My goal is to put the price guides on one and they show on all.
 

Donovan2580

Well-known member
Joined
Sep 13, 2020
Posts
435
Likes
237
I believe as long as the time frames are different it will work. Where you run into problems is when you want a 30 minute candlestick chart & a 30 minute footprint with the same stuff on it.

That is a whole other can of worms wherein you have to convert it every time via the Save As function. :rolleyes:

It would be nice if the Template function would bring in drawings, lines, etc as well as the studies but it doesn't.
 

erp

Member
Joined
May 26, 2023
Posts
16
Likes
9
Okay, I'll give it a shot later on and replay back. Appreciate the assist.

Edit: Just noticed your new image with the analyses. That's exactly what I've been using them for (TPO, daily, etc.). Have definitely run into issues perfecting that, but I'm still learning the software.
 

erp

Member
Joined
May 26, 2023
Posts
16
Likes
9
That worked for me with charts in the same page Donovan. I'll play around with it more. It might be a good solution for a few things I'm struggling with. Thanks for the tip.
 

Donovan2580

Well-known member
Joined
Sep 13, 2020
Posts
435
Likes
237
That worked for me with charts in the same page Donovan. I'll play around with it more. It might be a good solution for a few things I'm struggling with. Thanks for the tip.

Good to hear! (y)
 

erp

Member
Joined
May 26, 2023
Posts
16
Likes
9
Looks like this doesn't work if you want to include different studies on separate charts using the same analysis name. Say you use market profile and order flow tools. So different time frame candlestick charts with same analysis name - price guide shows on all and works fine. But, once I used the same analysis name and added volume imprint and TPO studies to try and have the price guides show across the three types of charts I use for level setting and intraday trading, the studies appear on all, as they are the same analysis name.

Oh well, thanks for the idea, as I learned something new. Not sure why it needs to be so unintuitive, but it seems several features are.
 

Donovan2580

Well-known member
Joined
Sep 13, 2020
Posts
435
Likes
237
I feel your pain. Some of that can be handled with the visibility options. For example I show the total volume delta on a 5 minute chart only and then the volume profile on a 1 minute chart only. If you time frames are not the same you can accomplish a lot w/the visibility options.

If you are looking at multiple charts with the same times frames (Ie 30 min vs 30 min) it gets a bit messier. Here is how I handle it.

I currently look at a 30 minute candle chart and I want to also have a 30 minute footprint chart with the exact same levels, price guides, etc on both of them.

Here is how I handle it - While it is a pain in the &#!, once you've done it a few times it really only takes a few seconds.

I maintain all of my levels, gaps, etc that I need on 30 minute chart with the analysis named "30 Minute". My footprint chart is a separate analysis file called "Footprint". I have saved the setup that I need for the footprint chart using a template and it is assigned to Hotkey Alt+1

Here is how I do it:

After I have the 30 minute analysis marked up I do a "Save As" > "Footprint"

It basically duplicates that chart and then I hit the Alt+1 hotkey to lay the footprint on top of all my "stuff".

Now I have a 30 minute footprint chart with all of the levels, etc from the original 30 minute chart.

When you do the "save as" it will automatically close the original chart, so you have to re-open it which is a huge pain.

I have spoken with support and this is really the only way to accomplish this at the moment.

Not ideal - But at least you have a roadmap of how to do it :)
 
Top