MotiveWave has become ssssllllooowwwwwwww as hell.

MatDerKater

Active member
Joined
Oct 19, 2020
Posts
33
Likes
9
MW wave has become slow as hell, and a real pain in the ass to use.

I am unsure whether this has to do with an update, or the amount of VP I have added to my spreads...

With that said, I have an i7 9700K Quad Core running at 4.5Ghz, 16GB ram on fast SSD drive, and whilst MW is hanging, waiting on VP to load, my system resources are barely getting used.

This issue needs to be sorted out...I can fly through the same things on TradingView with the click of the fingers.
 
Yeah well there are alot of things to load. this is just motivation to grind the ES in order to get a better computer
 
How will a better computer help, when my already fairly damn end gaming rig (also running a RTX2080), is barely being utilised?

Oh, and like I said, doing similar things with Trading View, is fast and snappy. Why?

As much as I love the layout and fucntionality of MW, the optimisation leaves much to be desired.
 
What you can try is configure the VP to use "historical minute bars" instead of ticks by default. The loading speed would increase significantly. When VP is set for a large period of time the amount of ticks to load and process is enormous.
You can't really compare your single PC to a cluster of machines used by TradingView on their server side.
 
Historical Minute bars are the default......

....No I can't compare my PC to TradingView's server farm.....

......but if my PC resources are barely being used and I am sitting twiddling my thumbs looking at loading screens?
 
MW will typically use around 3.7 Gig no matter what it is doing. CPU...barely gets it's sides touched.
 
You are maxing out the memory that is allocated by the OS for JVM. For 16gB PC - 4gB is max by default. May be this is the case.
 
What you can try is configure the VP to use "historical minute bars" instead of ticks by default. The loading speed would increase significantly. When VP is set for a large period of time the amount of ticks to load and process is enormous.
You can't really compare your single PC to a cluster of machines used by TradingView on their server side.
Hi Igor. I have had some questions about this "Use Historical Minute Bars". What I am noticing is that on my Volume Profile there is a difference in both the Value Area calculation and the POC when I have it checked or unchecked. Sometimes multiple points difference. Same goes for VWAP.

Is one more accurate than the other? If you are looking for accuracy what would be the ideal settings? Also, if you have the chart set to use Ticks but the indicator set to use historical minute bars does one override the other? Thanks
 
The ticks are more accurate. Keep in mind that when you use Historical minutes - the real time data, from the point you opened the platform, continue to use the Ticks to build the chart artifacts. That applies to tick based bars as well as studies.
 
  • Like
Reactions: OG1
The ticks are more accurate. Keep in mind that when you use Historical minutes - the real time data, from the point you opened the platform, continue to use the Ticks to build the chart artifacts. That applies to tick based bars as well as studies.
So, if I am using volume imprint or TPO study, then why would I ever turn off that function? I currently have it off for my Daily TPO, but on for my weekly TPO. It was my understanding that once you've downloaded tick data, it's stored in your computer's database, so if you had to reload a chart that you already have had up recently, it won't download any more ticks than what it needs to fill in the time you were logged out?

This feature, among many others, lacks a detailed explanation of what it does and how. Which is my biggest pet peeve about motivewave.

I have a less powerful computer than the original poster and I just want to say I'm running 3 desktops, each with at least 2 panels with about a total of 20 charts at all times, I almost never experience any lag. Ryzen 5 3600, 32GB PC4000 RAM, GTX 1660 Super, M.2 SSDs.
 
OP @MatDerKater and @dcoils101's PC are underuse for MW, their rigs are powerful for traders! Wish i have Mat's GPU lol

As I'm still using alienware laptop 2018 15R4 with 3 monitors - i7-8750H CPU @ 2.20GHz - RTX 1060 GPU - 32g RAM, 970Evo plus NVME
I did the following to optimize performance though.

To name a few, have you tried:

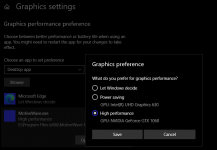
1. Go to Windows Graphics Settings - select MW - click on Option - Select your GTX2080 (High Performance)
2. I would dedicate 8GB Ram for MW in startup screen - Advance section (but like he said, my MW usually hovers around 3.x GB as well).
3. Have you optimized Windows itself at all? Check Win10 unnecessary Services running on background/start up.
4. Monitor Task Manager to see what's using your CPU & Ram while you are running MW.
5. Use LAN cable?

I found Rithmic Apex combine connection had been very unstable in the past month, stutter charts, long load time etc. I also found when use "Hide all studies", candles seemed load faster though. I have the usual TPO, volume imprint, delta, ichimoku variant loaded on different chart TFs.

But overall, for my case it was Windows itself messing sht up - I've using MW for over almost a year coming from long term SC, never looked back.
Best,
Daven
 

Attachments

  • wingraphicsettings.PNG
    wingraphicsettings.PNG
    32.1 KB · Views: 38
I agree @MatDerKater

See if this helps: adjust the UI Update Interval to around 250 milliseconds.

I get the linear and obvious next questions, but I don't have answers.
 
I am a stock trader and have to load new symbols many times each day. Motivewave is ridiculously slow loading new charts. Sometimes 40-60 seconds which in fast moving markets can cost a lot of money in opportunities missed. I don't even use complex volume indicators and I have an excellent rig. (my data is DXfeed which I know loads way faster in other platforms) They need to speed up their loading times big time! For guys like me changing symbols many times a day their platform is not competitive or professional.
 
Glad it's not just me. I use MW daily for hours on end, so every little delay adds up. Most of the delays seem to be when data needs to be retrieved. For instance, changing to a lower timeframe, skipping back to a period in the past, zooming out, or adding a study that requires tick/minute data.

The problem is that in most cases, the whole chart is locked while this data retrieval takes place, and can sometimes sit there for a long time with a progress bar overlaid on it and there is nothing that the user can do about it short of close and re-open the chart (which itself might require time to load). On many occasions every day, I accidentally switch to a lower timeframe than I intended (keyboard shortcuts), or accidentally zoom out too far (mouse wheel the wrong way) or some other thing that causes data loading, which results in an agonising wait while the whole chart locks in order to load new data.

A vastly better solution would be to implement a kind of "lazy loading" approach where the user can still interact with the parts of the chart for which data exists. The parts that are awaiting data to load can be greyed out or have some other form of progress display. I note that volume imprint already does this, so this is not a novel thing in the world of MW. (At the very least, one should be able to hit "esc" to stop the updating in order to, for example, switch back to a higher timeframe or remove a study that caused the delay. That alone would save me literal cumulative hours over time).

MW, I think it's great that you are working on a mobile app to remain competitive and all that, but don't forget that most of your customers are paying you for your excellent desktop platform, and likely don't care much for a mobile app. So don't forget about us.
 
Top