Is it possible to create a "Regular Trading Hours" study?

Donovan2580

Well-known member
Joined
Sep 13, 2020
Posts
435
Likes
237
Just throwing this out there for @Spin , @Shtick Hustler , @mattmar10 & any other programmers out there I may have forgot...

In futures markets, a lot of us get our data from either Rithmic or CQG. Both deliver the "End of Day" data (Daily Bars) as a 24 hour session. So if I want to pull up a weekly or monthly chart, the data is gathered from those bars and it is impossible to get a chart showing only "Regular Trading Hours" (IE - 9:30 a.m. - 4:15 p.m. E.S.T.).

If I am looking at a 30 minute chart for example. I can toggle 24 hour / Regular trading session with the built in "Show Extended Data" option on MW and it works just fine. If you try that same button on longer term charts it does nothing because of the issue described above.

I have a friend who runs Ninja Trader and they have a study that basically strips out the overnight data and creates these bars. The inputs on the study are "Open Time", "Close Time" and "Time Frame" (Daily, Weekly, Or Monthly).

My question to the programmers whom are much smarter than me at this kind of stuff.... Would making a similar study for MW be an easy thing to accomplish, or a huge deal?

Any input would be greatly appreciated.

Thanks much!

- Donovan
 

mattmar10

Active member
Joined
Jan 21, 2023
Posts
26
Likes
12
Its been months since I've worked with the MW sdk... I'll try to get re-aquainted with it and poke around
 

Spin

Well-known member
Joined
May 22, 2019
Posts
480
Likes
192
Just throwing this out there for @Spin , @Shtick Hustler , @mattmar10 & any other programmers out there I may have forgot...

In futures markets, a lot of us get our data from either Rithmic or CQG. Both deliver the "End of Day" data (Daily Bars) as a 24 hour session. So if I want to pull up a weekly or monthly chart, the data is gathered from those bars and it is impossible to get a chart showing only "Regular Trading Hours" (IE - 9:30 a.m. - 4:15 p.m. E.S.T.).

If I am looking at a 30 minute chart for example. I can toggle 24 hour / Regular trading session with the built in "Show Extended Data" option on MW and it works just fine. If you try that same button on longer term charts it does nothing because of the issue described above.

I have a friend who runs Ninja Trader and they have a study that basically strips out the overnight data and creates these bars. The inputs on the study are "Open Time", "Close Time" and "Time Frame" (Daily, Weekly, Or Monthly).

My question to the programmers whom are much smarter than me at this kind of stuff.... Would making a similar study for MW be an easy thing to accomplish, or a huge deal?

Any input would be greatly appreciated.

Thanks much!

- Donovan
Well @Donovan2580 , I read and re-read your post and I am wondering if I misunderstand it or not.

My question is this: if you only have a single 'end of day' bar per trading day, it will only have the values for that day's open, high, low and close, no ?
If that is the case, I cannot see how we would "distill" sub-bars from it :unsure:
Or is this bar somehow enriched with additional data ? Ticks perhaps ? Or extra barinfo including the price at the open / close ?

Can you show us a bar like that (or all the info you download about a trading day) in a .csv perhaps ? (Menu > File > Chart > Export data)
:)
 

Donovan2580

Well-known member
Joined
Sep 13, 2020
Posts
435
Likes
237
Well @Donovan2580 , I read and re-read your post and I am wondering if I misunderstand it or not.

My question is this: if you only have a single 'end of day' bar per trading day, it will only have the values for that day's open, high, low and close, no ?
If that is the case, I cannot see how we would "distill" sub-bars from it :unsure:
Or is this bar somehow enriched with additional data ? Ticks perhaps ? Or extra barinfo including the price at the open / close ?

Can you show us a bar like that (or all the info you download about a trading day) in a .csv perhaps ? (Menu > File > Chart > Export data)
:)
Thanks for the reply Spin!

So when I show a "Daily Chart" (IE - Daily Bar) it includes what happened in the overnight session... Per MW support this is the way the DAILY data is delivered from Rithmic and CQG. So when I toggle the Show Extended Data option nothing changes.

If I load up a bar chart that is lower than a daily time frame, say a 30 minute or 4 hour chart I can exclude the overnight data from that chart because the chart is being populated with smaller time frame data.

My logic was certainly flawed when I suggested trimming the overnight data from that current daily bar, as you are correct there is only an open, high, low, close, etc... I believe these longer term charts would have to be built from a 15 minute chart or something like that. The data is certainly present in MW to build these charts & since they are time based (Not tick, volume, etc) I would think it would be a rather easy calculation for MW.

Figuring out how to get MW to make those calculations is the part I need help with ;)

If you still need a .CSV file with the daily data I can get it to you, but you pointed out a fatal flaw in my original idea which seemed to easy 🤣
 
Last edited:

Spin

Well-known member
Joined
May 22, 2019
Posts
480
Likes
192
Ok, gotcha :)

I dug around the SDK for a bit and I think the 'OHLC'-Study has the logic you are looking for on board.

Can you drop it on a chart and see whether it 'excludes' the overnight data on Daily charts ?
(You would obviously need to set the 'timeframe' in the Study's menu to at least 'weekly', or no lines will show)

If the OHLC-Study DOES show a difference between 'regular' and 'extended', it might be feasible to use the logic it has on board to draw candles (instead of the OHLC-lines)
 

Donovan2580

Well-known member
Joined
Sep 13, 2020
Posts
435
Likes
237
Ok, gotcha :)

I dug around the SDK for a bit and I think the 'OHLC'-Study has the logic you are looking for on board.

Can you drop it on a chart and see whether it 'excludes' the overnight data on Daily charts ?
(You would obviously need to set the 'timeframe' in the Study's menu to at least 'weekly', or no lines will show)

If the OHLC-Study DOES show a difference between 'regular' and 'extended', it might be feasible to use the logic it has on board to draw candles (instead of the OHLC-lines)

Hey Spin - So I just tried it and it does in fact work!!!

I use that study every day on a 30 minute chart and it will certainly pick out the "Previous Day High / Low" based on Regular trading hours.

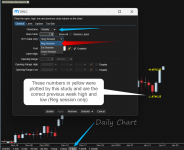
I just put the OHLC Study on a daily chart of the ES and then picked Weekly & Reg Session... Last Weeks high and low came in perfectly and it properly dropped the overnight numbers!!

Is it possible to use that logic to create a bar chart? 🤓

Thanks again spin! Here is a little screenshot of what I put on / the settings, etc.

1705929030286.png
 
Last edited:

Spin

Well-known member
Joined
May 22, 2019
Posts
480
Likes
192
Thanks for figuring that out, @Donovan2580 ! (y)

I will look into this when I have 5 minutes to spare (and will need to find a way to check my code: none of my FX-accounts has 'regular' trading hours, since those markets are open 24/5)
 

Donovan2580

Well-known member
Joined
Sep 13, 2020
Posts
435
Likes
237
Thanks for figuring that out, @Donovan2580 ! (y)

I will look into this when I have 5 minutes to spare (and will need to find a way to check my code: none of my FX-accounts has 'regular' trading hours, since those markets are open 24/5)

Much appreciated Spin - Thank you!! 🙏
 
Top