Volume Profile

Pejman

Well-known member
Joined
May 22, 2019
Posts
82
Likes
17
Hi Guys
is anyone works with Volume Profile here?
Can we trust this tool when we put it on a daily and above charts? because all studies that have "Tick Interval" option in there they work for timeframes less than daily (Tick data) and they are not even shown on daily and above charts , but Volume profile although has "Tick Interval" in it it is shown on every timeframe. Just i want to make sure i can use it.
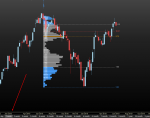
21

thanks
 

MotiveWave_Jason

Moderator
Staff member
Joined
Mar 26, 2019
Posts
224
Likes
101
Hi Guys
is anyone works with Volume Profile here?
Can we trust this tool when we put it on a daily and above charts? because all studies that have "Tick Interval" option in there they work for timeframes less than daily (Tick data) and they are not even shown on daily and above charts , but Volume profile although has "Tick Interval" in it it is shown on every timeframe. Just i want to make sure i can use it.

View attachment 21

thanks

Hi Pejman,

That looks like the Volume Profile Component? The VP Component only uses tick data so it will only show a profile from the tick data you have. I'm not sure what instrument this is or which data connection you're on so I can't really comment on your specific example's accuracy.

You may want to look into the Volume Imprint study and the Volume Profile study, both are able to use historical bars (minute and daily) along with tick data for their calculation.
 

sragone

Active member
Joined
May 23, 2019
Posts
31
Likes
22
I use the volume profiles very extensively in my trading as I know that they can effectively show support and resistance levels. The best way that I’ve found to learn about trading with volume profiles is to use the market replay.

In the replay options I use the following settings:
  • Source Data: Tick Data
  • Check the box on “Real Delay”
  • Uncheck the box on “Step Until Price Change”
  • Speed Factor: 50
After choosing those settings, simply rewind back to a date of your choosing and apply the volume profile to an intraday time chart. In the properties section of the volume profile, I usually display it on the right side of the chart, so that as the candles are displayed, they don’t block the profile so that you can’t see it.

When you play it through, watch the market’s reaction as the profile begins to build. Pay particular attention as the market approaches the point of control or the POC as it’s called. With volume profiles you will very easily spot the fair and unfair pricing levels in the markets.

I’ve found that volume profiles can also be used to detect stop runs. If you have a spike in the market and the volume profile remains thin near the top or the bottom of the spike candle, chances are that it was either a stop run or a temporary spike after a news release as there was no real commitment in the auction.

Hope this helps.

Shane
 

Pejman

Well-known member
Joined
May 22, 2019
Posts
82
Likes
17
Thanks Jason and Shane . appreciate it

But i use EOD Data (CSV file).
Can we consider each bar as a tick in Volume profile and volume imprint? or tick word is just used for intraday charts?

Thank
 

MotiveWave_Jason

Moderator
Staff member
Joined
Mar 26, 2019
Posts
224
Likes
101
Thanks Jason and Shane . appreciate it

But i use EOD Data (CSV file).
Can we consider each bar as a tick in Volume profile and volume imprint? or tick word is just used for intraday charts?

Thank

When I use the term tick data I mean actual individual trade price and the volume of each trade. This will give you the most accurate view of volume profile.

If you use historical bars (minute or daily) for volume profile the accuracy will be decreased compared to tick data because the best you can do is distribute the total volume of that bar evenly between the high and low which isn't exactly how volume distributes in real life.

If you used something like the Volume Profile study (updated in version 6 Beta 2) it would take your daily bars and distribute the total volume between all prices in the bar. For a long term view of an instrument this is usually sufficient.
 

OG1

Active member
Joined
Mar 27, 2022
Posts
30
Likes
6
When I use the term tick data I mean actual individual trade price and the volume of each trade. This will give you the most accurate view of volume profile.

If you use historical bars (minute or daily) for volume profile the accuracy will be decreased compared to tick data because the best you can do is distribute the total volume of that bar evenly between the high and low which isn't exactly how volume distributes in real life.

If you used something like the Volume Profile study (updated in version 6 Beta 2) it would take your daily bars and distribute the total volume between all prices in the bar. For a long term view of an instrument this is usually sufficient.
Hi Jason, thanks for the explanation in this thread. I am wondering how using Historical Minute Bars or not using them affects a study like VWAP? I have noticed differences in VWAP value when I have UHMB (use historical minute bars) checked or unchecked.

Also, for something like POC on Volume Imprint study, if this is different when UHMB is checked or unchecked, is this because having it unchecked would be more accurate because it is calculating the actual volume at that tick, whereas when UHMB is checked it is distributing the volume equally among all ticks on that bar? Would this affect the value should you be using 1 minute versus 1 hour bars on the chart, as an example?

My final question on that subject is on the Use Tick Data (Max Days) setting in preferences or chart settings. Can you explain what the accuracy/performance/lag implications would be if it is set to 1 vs 10 days?

Thanks
 
Top