desertskeis
Member
- Joined
- Dec 26, 2020
- Posts
- 10
- Likes
- 0
I have been using TDA / TOS for about 6 months and am trying to get more into using MW since it allows me to connect both my TDA and IBKR accounts on one platform.
couple questions:
Thanks again
couple questions:
- is there a way to easily quickly switch studies / indicators on a chart? Presently I have a couple saved templates, on with Vwap and some moving averages, another with Ichimoku clouds. Switching of course is just right clicking and chosing the template, but then how do I go back to a naked chart, for some reason that escapes me. On TOS I have my charts set so that I have buttons at the top of my chart pages were I can select naked chart, ichimoku, Std Dev Channels, and a couple with vwap and moving averages, the switch is quick and easy. I like MWs customization but it can be cumbersome when stuff is hitting the fan in the markets (which seems pretty common lately)
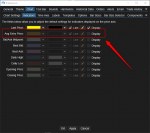
- Is there a way to have an average trade price indicator horizontal line on a chart? I see my avg trade price in the POS field in the trade panel and the P/L and I have the BOT and SOLD indicators as horiozontal lines as I buy and sell but dont find a trade price. I have that on my TOS platform and it is incredibly helpful.
- The POS P&L indicator in the trade panel I believe is the P&L for just that trade since the open of that trade, can I also get the P&L day indicated there as well?
- Trying to enter trades pre and post market on MW - I can easily do this on TOS and TWS but cant seem to find the right setting for MW. In the Trade Panel / Position tab / TIF choser the only option I recognize is DAY and GTC, have no idea what the others (GTD, IOC, OPG) mean and none make it possible to enter trades pre or post market.
- order types - what is a MIT order
Thanks again

