Question about Horizontal lines

TickScalp

Member
Joined
Nov 20, 2020
Posts
19
Likes
2
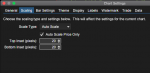
I draw an horizontal line at the bottom of the chart. Now the automatic vertical zoom feature stretch the chart to include the line. How do i exclude that?

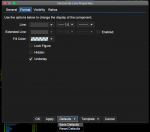
How to assign a 'default' template to every new line i draw, insted of changing it manually every time?


484
 

TickScalp

Member
Joined
Nov 20, 2020
Posts
19
Likes
2
Ok i have found how to exclude the drawing from the auto-scale.

Now i've to find if there's a way to set a default setting for new drawings
 

Attachments

  • Schermata 2020-11-23 alle 16.05.19.png
    Schermata 2020-11-23 alle 16.05.19.png
    36.9 KB · Views: 9

TickScalp

Member
Joined
Nov 20, 2020
Posts
19
Likes
2
There was literally a "Save Default" Options.

Problem solved.
 

Attachments

  • Schermata 2020-11-24 alle 22.49.50.png
    Schermata 2020-11-24 alle 22.49.50.png
    54 KB · Views: 3

TickScalp

Member
Joined
Nov 20, 2020
Posts
19
Likes
2
New question: is there any way to show my price levels (of the lines i draw) on the Price axis? Like you see with the OHCL values in this chart
 

Attachments

  • Schermata 2020-11-29 alle 12.16.55.png
    Schermata 2020-11-29 alle 12.16.55.png
    54.8 KB · Views: 12

Spin

Well-known member
Joined
May 22, 2019
Posts
477
Likes
191
How about you use 'guides' instead ?

Right click in the 'scale' area > add guide

You can also adjust those (type, color, size, ...) and they have their levels plotted in the price area.

527

Or you could continue using horizontal lines, but tick the box for 'show info'.

You can then move the green dot to place the price-info where you want it

528
 
Top