SydneySailboat
Member
- Joined
- Jan 24, 2021
- Posts
- 11
- Likes
- 2
Hello,
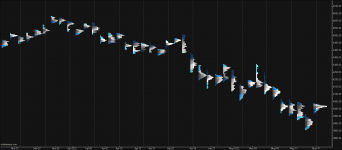
How can I compress the TPO study to display more profiles in the window? ie to zoom out and see a greater range of profiles to mark out balance areas etc?
Dragging the price axis up and down compresses them vertically as it should but dragging the time axis just overlaps the profiles rather than decreasing the width.
If I modify the constrain width setting to 1, more profiles can show on screen, but they can not then be zoomed in to see and detail.
thanks

