Spin
Well-known member
- Joined
- May 22, 2019
- Posts
- 478
- Likes
- 191
This issue keeps annoying me, so I want to get rid of it once and for all ") .
.
I already posted about previous difficulties with adding plots to custom-coded Studies and their (supposed) relation to the Study's name being printed twice in the upper left corner of the price chart (see here)
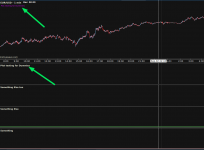
The story continues. I have created a 'skeleton'-study (in attachment to this post) that does nothing, except create 3 extra plots below the price plot.
I add the three additional plots like this:
This method has served me well, until recently. I now notice an extra plot keeps popping up, with the same label:

Something is clearly 'off' here, but I cannot seem to put my finger on it.
I tried fiddling with the 'overlay' & 'studyOverlay'-settings, but that only half solves the problem: the extra plot disappears, but on the main (price) plot a second instance of the Study's name is added.
I kindly request my fellow coders here to copy/paste the code into a .java file, import the .java file into their SDE and compile it to see if they have the same result. And perhaps someone can even solve this issue ?
(I'm adding the people from the previous thread, so we can continue the conversation here: @MotiveWave_Joe @Dragon @ScottyA )
The skeleton-code can be found here:
https://pastebin.com/06p0XWXN
Many thanks in advance for trying to help out !! 💪💪
.I already posted about previous difficulties with adding plots to custom-coded Studies and their (supposed) relation to the Study's name being printed twice in the upper left corner of the price chart (see here)
The story continues. I have created a 'skeleton'-study (in attachment to this post) that does nothing, except create 3 extra plots below the price plot.
I add the three additional plots like this:
Java:
// Some Plot

Plot firstPlot = new Plot();

desc.addPlot(First_PLOT, firstPlot);
This method has served me well, until recently. I now notice an extra plot keeps popping up, with the same label:
Something is clearly 'off' here, but I cannot seem to put my finger on it.
I tried fiddling with the 'overlay' & 'studyOverlay'-settings, but that only half solves the problem: the extra plot disappears, but on the main (price) plot a second instance of the Study's name is added.
I kindly request my fellow coders here to copy/paste the code into a .java file, import the .java file into their SDE and compile it to see if they have the same result. And perhaps someone can even solve this issue ?
(I'm adding the people from the previous thread, so we can continue the conversation here: @MotiveWave_Joe @Dragon @ScottyA )
The skeleton-code can be found here:
https://pastebin.com/06p0XWXN
Many thanks in advance for trying to help out !! 💪💪
Attachments
Last edited: