The tick sizes will be available if your connected broker/feed supports historical tick data. If it doesn't, then tick charts will not be available.
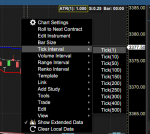
If they are available, the option will also be listed under the Bar Settings tab by right clicking on the chart and then selecting the Bar Size dropdown field:
Hi Joe,
I am connected to CQG and they provide all available candle types and tick data, however the only option I see is linear. Can you please help resolving this issue. Thanks
This site uses cookies to help personalise content, tailor your experience and to keep you logged in if you register.
By continuing to use this site, you are consenting to our use of cookies.