Has anyone seen this indicator before????

WildeyChris

Active member
Joined
May 26, 2023
Posts
40
Likes
9
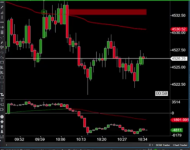
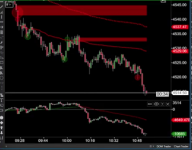
He(DejaBrew Trading) seems to have a study running on a 1min that uses previous levels to indicate buy and sell bars. This is kinda what it looks like... can anyone help me figure out what this is... It was from today(Sept 15th) at 7am PST(10am EST)
 

Attachments

  • Screen Shot 2023-09-15 at 7.34.54 AM.png
    Screen Shot 2023-09-15 at 7.34.54 AM.png
    109.4 KB · Views: 52
  • Screen Shot 2023-09-15 at 7.54.21 AM.png
    Screen Shot 2023-09-15 at 7.54.21 AM.png
    107.2 KB · Views: 51
Last edited:

nooris

Well-known member
Joined
Jul 30, 2023
Posts
143
Likes
69
No clue where to find it (other than him). Also I can't vouch for how well it works, I just recognized it because I follow him on X and he often posts about it.
 

Donovan2580

Well-known member
Joined
Sep 13, 2020
Posts
435
Likes
237
I think youre spot on @nooris Thank you... anyone know where to get something like this for motivewave?

I am not sure if that is Aaron's from Mind Unbound, but it certainly looks very similar. I know he (Aaron @ Mind Unbound) includes that indicator for MotiveWave with a subscription to his service.
 

luissantillana33

Well-known member
Joined
Nov 25, 2020
Posts
206
Likes
66
That is from the platform ATAS & is included in their platform. I am sure you can get something like this for coded for motivewave via one of the programmers. On ATAS i think it might be called the dynamic level indicator. i'll have to double check.
 

Spin

Well-known member
Joined
May 22, 2019
Posts
480
Likes
192
Do we know what the logic looks like ?

"If X and Y happen, and the last close was below Z, then draw a box .... "

If you could provide me with that (either here or in PM), I could look into coding it, yes


EDIT: But I will only code it if the logic is publicly available. I don't want to re-code someone's 'special sauce', especially not when the owner puts it out there for sale or lease him/herself
:)
 

WildeyChris

Active member
Joined
May 26, 2023
Posts
40
Likes
9
Do we know what the logic looks like ?

"If X and Y happen, and the last close was below Z, then draw a box .... "

If you could provide me with that (either here or in PM), I could look into coding it, yes


EDIT: But I will only code it if the logic is publicly available. I don't want to re-code someone's 'special sauce', especially not when the owner puts it out there for sale or lease him/herself
:)
I don't yet... I'm guessing it has to do with something with bidxask #'s
 

WildeyChris

Active member
Joined
May 26, 2023
Posts
40
Likes
9
I am not sure if that is Aaron's from Mind Unbound, but it certainly looks very similar. I know he (Aaron @ Mind Unbound) includes that indicator for MotiveWave with a subscription to his service.
Do you know of anyone else who uses something like that on motivewave?
 

Donovan2580

Well-known member
Joined
Sep 13, 2020
Posts
435
Likes
237
Do you know of anyone else who uses something like that on motivewave?
Orderflow Labs has buy and sell zones & well as liquidity zones and a ALOT of other stuff...

Have you played around with the built in Support and Resistance lines that the volume imprint tool generates (Through the imbalance tab)? I find them to be very useful and it is already right there in the software.
 
Top