davaei
New member
- Joined
- Nov 23, 2021
- Posts
- 4
- Likes
- 4
Hi Devs
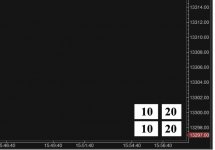
1- I want to create a grid in the bottom right of chart or under the chart like Volume Imprint Totals grid (attached screenshots) but i dont know how.
I tried Box drawing class but the Box class coordinates use time and value which is not useful for static coordinate.
2- I am in 15 minutes timeframe chart and i want to get open,close,low,high of related candle in higher timeframe like 1 hour timeframe.
I know i can pass barsize to DataContext like below but series.size() return 0 :
protected void calculateValues(DataContext ctx)
{
var series = ctx.getDataSeries(BarSize.getBarSize(Enums.BarSizeType.LINEAR, 15));
debug(String.valueOf(series.size()));
}
Anybody have experience or solution for them ?