Feature Request: Daily RTH-only and ETH-only bars

MrHwang

Member
Joined
Apr 9, 2021
Posts
15
Likes
16
We need RTH-only daily bars and ETH-only daily bars. I use these in IRT to get a broad picture of the market on a higher timeframe. I use Rithmic for data/routing.

I've read two other threads. It seems there is not a clean method for getting RTH-only daily bars. But we need both, anyway. https://support.motivewave.com/foru...-do-i-show-only-rth-data-on-daily-charts.613/ || https://support.motivewave.com/forum/index.php?threads/daily-rth-only-chart.441/

I'm a new user to MW. I signed up during the 25% off sale, and I love it. Honestly, with MW, I could get rid of both Bookmap (Global+) and InvestorRT, and just use MW Order Flow package. Big cost-savings. But this one problem is a big handicap---that could be fixed.

The daily RTH-only and ETH-only bars could be constructed within the local database (from 1-minute or 1-second bars) if the data provider does not provide easily consumable data. The RTH-only and ETH-only bars should show the correct bar-start/end times and correct OHLC-V. The correct total volume for each session is important.

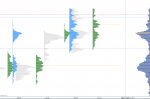
I use such bars for a variety of things, including constructing composite volume profiles (of arbitrary numbers of bars). These profiles don't need pure tick data; using 1-min or 1-sec bars as the underlying data would be sufficient. Right now, I'm not sure what data is being included in the profile and what is not. The workarounds don't make it clear either. Moreover, workarounds are not what I want to deal with when learning a whole new platform. I'd just stick with IRT, which does everything already.

Finally, if I am missing something or am wrong about anything, my apologies. Please let me know. It's frustrating to see a great platform handicapped by a fixable problem. I am new, so hopefully I'm just missing something.

Take care, everyone.
 
Last edited:

Donovan2580

Well-known member
Joined
Sep 13, 2020
Posts
431
Likes
236
I could not agree more. Getting a RTH only daily chart should not be this big of a deal. I have to use Think or Swim to get a clean chart.

I am on a Rithmic feed; seems like if we can get millisecond data than a simple daily bar from RTH open to close should not be too much to ask. :)

While it is true that the markets basically trade 24 hours, many day traders need this RTH data for structural levels.

Obviously the data is there, we just need to ability to parse it.

This is a HUGE hole in the software.

Just my 2 cents (y)
 

alexjp

Member
Joined
Apr 7, 2021
Posts
20
Likes
16
I am just on trial yet and sorry if I misunderstood, but currently i have the volume profile split between RTH and ETH ( it will create one with a different color on ETH and another with another color on RTH ). This option is available in the Volume Imprint study ( using the volume profile method ) , not the Volume Profile.

About the daily open of RTH ... well, its possible ( like in the attached image ) but its a workaround. Its using a "volume imprint" study, set with the "ladder" method and showing only RTH ( and hiding the texts and using historical minute bars for performance ).

Just trying to help, if it solves until proper development, great :)
 

Attachments

  • Screenshot_20210410_030427.png
    Screenshot_20210410_030427.png
    36.7 KB · Views: 20

MrHwang

Member
Joined
Apr 9, 2021
Posts
15
Likes
16
I am just on trial yet and sorry if I misunderstood, but currently i have the volume profile split between RTH and ETH ( it will create one with a different color on ETH and another with another color on RTH ).
I appreciate your response, thank you. Your workaround may draw RTH bars but what you initially described is not exactly what I'm talking about.

For volume profile, I want to be able to draw a composite profile over 'x' number of bars (which I can already do with MW) but I want those bars to be ETH-only bars and/or RTH-only bars, if that makes sense. By ETH-bars, I mean one bar that represents the entire overnight session for that day. Same for RTH bars. There would be five ETH bars per calendar week and five RTH-bars per calendar week. None of those bars would overlap the same time of day.

The profile spans multiple calendar days (some arbitrary number 'x') but this composite profile only includes data from either a) only the ETH session or b) only the RTH session for those days. It's not a profile of a single ETH or RTH session. Instead, it's a composite profile of mulitple ETH-only sessions or multiple RTH-only sessions. This show levels that are respected in the respective sessions, which is important to me. Smushing the RTH and ETH together into one bar doesn't make sense to me.

I also look at the relative volumes, see how the ETH-only/RTH-only volume grows/declines relative to the average or median volume for the ETH-only / RTH-only session. I see how the ETH range and RTH range grows/contracts over time.

To be clear, by ETH, I mean the overnight (ON) session. The full session (FS) is the whole day or ETH+RTH combined.

One addition: InvestorRT also allows me to look at intraday bars of just the ETH session; e.g., 5min bars of only ETH session for several days. I can already do this with respect to RTH session in MW. But it doesn't appear that I can do this with respect to the ETH session. Again, the purpose here is to show me levels respected during only the ETH session and compare those levels to the levels respected during only the RTH session. This is the primary purpose of all this discussion. I'm thinking I could probably edit the sessions' definitions to do this, tho. I apologize if I'm turning into one of those internet trolls.

This is a HUGE hole in the software. Just my 2 cents (y)
It really is, and what kills me is MW is actually superior in so many respects. I thought MW only dealt with Elliot wave stuff. Someone I knew said he liked MW. I saw the 25% discount and signed up. Turns out, I really like it a lot too. It's smooth, elegant, and powerful. What more do I want? Well....ETH-only and RTH-only bars. lols.

Having said all that, thank you both for responding. I really like MW a lot, and apologies for wordiness.
 
Last edited:

alexjp

Member
Joined
Apr 7, 2021
Posts
20
Likes
16
ahh sorry, i misunderstood !

as a challenge, this is what I could came up with ( see attachment ), but it doesnt work :( the volume profiles get one on top of the other.

In the image: 1 VP for RTH (green), 1 VP for ETH(gray) and 1 VP for aggregating 2 days of Full Session(light blue) and 1 VP at the right for 10days volume(dark blue).

( I am messing with this because I too use VP that separate RTH from ETH, so also seeing what MW can do for my own usages, although my "aggregating VP" is for all volume in the chart, which it does work very well ( VP gets static align to the right ) ).

Anyway, thank you for your time explaining in more detail.
 

Attachments

  • Screenshot_20210410_040308.png
    Screenshot_20210410_040308.png
    32.5 KB · Views: 10

Donovan2580

Well-known member
Joined
Sep 13, 2020
Posts
431
Likes
236
Hi Alex,

Thanks for the suggestion. While that is probably the best workaround I have seen I guess the problem with that is the amount on unnecessary data that is being processed just to hide it in the end. I already have support telling me that loading multiple profile/imprints, etc will bog the system down.

Seems like the logical solution would be to actually make the "Show extended data" option actually work on a daily/weekly/monthly chart.

Your suggestion is appreciated and I might toy around with that in the meantime :)

I have an entirely different reason for wanting RTH only charts as @MrHwang but I believe fixing the option below would work for both of us.

2021-04-09_22h50_38.png
 

MrHwang

Member
Joined
Apr 9, 2021
Posts
15
Likes
16
Anyway, thank you for your time explaining in more detail.
No no, seriously, thank you for trying and putting forth so much effort here. I'm old and a little bleary eyed right now. I will try to come back and refocus on your last post when I've had rest. It's nice to hear from folks who really put in the work. All the respect in the world to everyone here.
 

alexjp

Member
Joined
Apr 7, 2021
Posts
20
Likes
16
Hi Alex,

Thanks for the suggestion. While that is probably the best workaround I have seen I guess the problem with that is the amount on unnecessary data that is being processed just to hide it in the end. I already have support telling me that loading multiple profile/imprints, etc will bog the system down.

Seems like the logical solution would be to actually make the "Show extended data" option actually work on a daily/weekly/monthly chart.

Your suggestion is appreciated and I might toy around with that in the meantime :)

I have an entirely different reason for wanting RTH only charts as @MrHwang but I believe fixing the option below would work for both of us.

View attachment 744


Yeah, I was also clicking it a lot of times a little surprised it didn't make anything on daily and above, since it did for minutes :)

Well if you do use this workaround, make sure you select the "historical minute bars" setting in the study, it will be much lighter. But yeah ... using a Volume study just to draw candles is overkill... :)
 

igor.s

Well-known member
Joined
May 22, 2019
Posts
286
Likes
152
Hi guys,

Just read your whole discussion. I understand a potential lack of the platform capability to show only RTH daily. But to show daily ETH, RTH or FS seems an overkill. I would not call those bars daily anymore. Those are session specific timeframes that happened to be part of a real daily candle. The MW team is very responsive to the needs of the traders but I believe they are focused first on the features that are used by majority.

You have some flexibility to use what is offered by the platform to accomplish your specific needs. Take a look at the following:
- Custom instrument (based on the one you trade but want to slice up per session)
- Custom trading hours (only hours for a specific session)
- Intraday bar start point

You may not able to put those 2 or 3 sessions on the same chart but having separate charts (one for each custom instrument) would still do the trick for your analysis.

Cheers.
 
Top