You are using an out of date browser. It may not display this or other websites correctly.
You should upgrade or use an alternative browser.
You should upgrade or use an alternative browser.
Drawing Tools Linking
- Thread starter SamB60
- Start date
- Joined
- Mar 26, 2019
- Posts
- 224
- Likes
- 101
Hello Sam,
If you would like to have multiple charts of the same instrument you can create an alternate analysis. With an alternate analysis you can have different studies and drawings. Please see this video section on our website https://support.motivewave.com/videos/#analyses
Thank you.
If you would like to have multiple charts of the same instrument you can create an alternate analysis. With an alternate analysis you can have different studies and drawings. Please see this video section on our website https://support.motivewave.com/videos/#analyses
Thank you.
MatDerKater
Active member
- Joined
- Oct 19, 2020
- Posts
- 33
- Likes
- 8
I am trying to find a way to link drawings to all charts of the same instruments on a page....
.....thought this function would be straightforward, but.....nope.
.....thought this function would be straightforward, but.....nope.
- Joined
- Mar 26, 2019
- Posts
- 223
- Likes
- 67
Hi,
Would you be able to provide more details and perhaps a screenshot of what you are trying to do?
Thanks.
Would you be able to provide more details and perhaps a screenshot of what you are trying to do?
Thanks.
I think MatKerKater may be trying to a similar thing to what I would like to do.
Let's say I have 3 charts all of the same instrument.
Chart 1 = 5 min candlestick chart, VWAP, volume imprint, NO extended data
Chart 2 = 5 min candlestick chart, VWAP, Midline, 9 and 20 period EMA's
Chart 3 = 2 tick Renko chart, VWAP, Zigzag
Now let's say I have key support and resistance levels I want to identify and watch. I want to add a price guide, horizontal line, resistance level component or whatever (I prefer the price guide) to ONE of the charts and have it show up on ALL of the charts.
This type of capability is supported in say NinjaTrader. You simply select the component and there is an option to make it "Available on all charts of the same instrument".
From what I can tell use of an analysis requires the all the charts have the same studies. If you notice above the 3 charts specifically DO NOT have all the same studies.
Is there a way to apply 2 Analyses to a chart? Therefore I could have a "Levels" analysis that contains just my support and resistance levels that I then overlay on top of the existing analysis on the chart.
MatDerKater
Active member
- Joined
- Oct 19, 2020
- Posts
- 33
- Likes
- 8
If you want drawings (and any other changes) to appear instantly across multiple charts, you need to create 'analysis' charts. Each analysis chart with the same name, will automatically update all drawings and indicator changes applied to them, unless you select for the drawing/study to only be available on a certain time frame, or range of time frames. In the snip I took of my MW screen below, you will see that I have 'Analysis named Boroden Clusters Bear, Boroden Cluster's bull etc. Whenever I put in drawings in one of these charts, it will automatically appear in every analysis chart that I have running for that symbol. Ao in Boroden Clusters Bull's case, If I draw a Fib retracebox or a Trendline on the weekly chart, it will draw it on the weekly Boroden Clusters Bull chart, right down to the 1 minute BC Bull chart.....not the most straightforward system, but when you get it set up, I find it works quite well, and is a good way of keeping different line of thinking, organised and seperate.

Attachments
Last edited:
SydneySailboat
Member
- Joined
- Jan 24, 2021
- Posts
- 11
- Likes
- 2
Hi,
Would you be able to provide more details and perhaps a screenshot of what you are trying to do?
Thanks.
5 minutes ago
- New
- Add bookmark
- #8
If the charts are the same analysis then my drawings appear on all charts, this is good.
also the indicators display on all charts, this is bad.
I would like to have a TPO chart open to find and mark my levels and have them populate to my 1 minute naked execution chart. When set to the same analysis the TPO profiles also populate on the execution chart. So right now I'm finding my levels, writing them on a legal pad then redrawing them on my execution chart, there must be a better way but I cant seem to find it.
If you want drawings (and any other changes) to appear instantly across multiple charts, you need to create 'analysis' charts. Each analysis chart with the same name, will automatically update all drawings and indicator changes applied to them.....
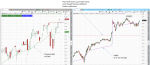
@MatDerKater can you confirm that you have different studies on your charts? For some reason the resolution of the picture attached isn't very good and I can't zoom in to see what studies you have on each chart. However it appears that your charts are identical except for different timeframes. Can you replicate the following (ThinkorSwim example shown in picture below):
1) Daily chart with a 20 day simple moving average
2) 5 min intraday chart with no moving average but instead a VWAP study.
3) Can you then draw a trendline on the daily chart and have it show up on the intraday chart?
I'm really hoping that you can!
Just like @eightsixty I want to be able to draw important levels for a single instrument and have those levels show up on different types of charts. This is a very common practice for traders and platforms like NinjaTrader, ThinkorSwim, and others can do this very easily.
Attachments
MatDerKater
Active member
- Joined
- Oct 19, 2020
- Posts
- 33
- Likes
- 8
@MatDerKater can you confirm that you have different studies on your charts? For some reason the resolution of the picture attached isn't very good and I can't zoom in to see what studies you have on each chart. However it appears that your charts are identical except for different timeframes. Can you replicate the following (ThinkorSwim example shown in picture below):
1) Daily chart with a 20 day simple moving average
2) 5 min intraday chart with no moving average but instead a VWAP study.
3) Can you then draw a trendline on the daily chart and have it show up on the intraday chart?
I'm really hoping that you can!
Just like @eightsixty I want to be able to draw important levels for a single instrument and have those levels show up on different types of charts. This is a very common practice for traders and platforms like NinjaTrader, ThinkorSwim, and others can do this very easily.
I have around 15 different timeframes 5 on each screen, and within each timeframe, I have 5 further separate analysis charts. Across the entire Layout, anything I do in Analysis A, will appear in every instance of Analysis A across all timeframes for that asset, but will not appear in Analysis B. This is the only way to do it in MotiveWave, which does seem rather clunky to begin with, but I actually like it. It forces\helps the trader to be much more organised in his analysis.
What you are trying to do, is possible up to a point, but with MotiveWave, it will be a much more clunky process than required. You would need to create a linked Analysis chart, then add everything onto it that you wanted, and then simply 'hide' the shit u don't want on each individual chart\timeframe. They really should have at the very least an 'Apply Globally' option for drawings etc.
MatDerKater
Active member
- Joined
- Oct 19, 2020
- Posts
- 33
- Likes
- 8
Right...just here letting off steam.....whilst it is possible to do what you want to do......the means by which you need to go about doing it is clunky beyond belief.
I have just wrecked my layout by loading up a 'template' whilst all the charts are linked....no way to undo it.....
The linking system in this package needs serious reworking...been over 90 minutes trying to rebuild what I had...not even close to finishing it.
I have just wrecked my layout by loading up a 'template' whilst all the charts are linked....no way to undo it.....
The linking system in this package needs serious reworking...been over 90 minutes trying to rebuild what I had...not even close to finishing it.
^^^^ Ugh, sorry to hear about that. Been there myself.
I'm starting to wonder if the programmers and project managers have any trading experience or if they are just "programmers".
Seems like an enormous lack of understanding of what customers want and what the competitors provide.
Is MW even looking at existing platforms? Have they ever heard of competitive research.
MW, if you read these threads please listen to your customers. For gods sake you can't even create daily bars unless the "data provider includes it in their feed". Are you kidding me? Your platform has trading hours, it has every tick of the day, pretty damn simple to generate the open/hi/lo/close from that information. LITERALLY EVERY OTHER PLATFORM CAN DO IT.
MatDerKater
Active member
- Joined
- Oct 19, 2020
- Posts
- 33
- Likes
- 8
..and after some 3 hours of mindless graft.....I have just done it again.....the only way to get an asset symbol to remain constant on a page, is to link every single chart and tab on that page....so just that task alone is around 40 move and clicks for me (and lets face it, it could easily just be 2)......then open up a new analysis, without first unchecking the link tab, it applies the template to the entire page, and there is no going back. No Ctrl Z. No Undo.
It really is a complete fucking shambles of a system that is in bad need of sorting.
Will have to contemplate whether it is worth the aggravation of persisting with it or not.
Instead of trading, I am fighting with my analysis platform.
It really is a complete fucking shambles of a system that is in bad need of sorting.
Will have to contemplate whether it is worth the aggravation of persisting with it or not.
Instead of trading, I am fighting with my analysis platform.
FinalDevil
New member
- Joined
- Apr 21, 2021
- Posts
- 4
- Likes
- 2
Hello, are you there? We are all need that feature. It is as simple as that all charts in the same page sync drawing together no matter what they are same "analysis" or not.Hi,
Would you be able to provide more details and perhaps a screenshot of what you are trying to do?
Thanks.
I have one footprint chart, one simple candle stick chart to find key level. I want to find key level on the simple candle chart, draw a horizontal like on that, then it should automatically sync that line to the footprint chart. Simple as that all other platforms providing it as is.
Hello, are you there? We are all need that feature. It is as simple as that all charts in the same page sync drawing together no matter what they are same "analysis" or not.
I have one footprint chart, one simple candle stick chart to find key level. I want to find key level on the simple candle chart, draw a horizontal like on that, then it should automatically sync that line to the footprint chart. Simple as that all other platforms providing it as is.
It would be nice if MW used this forum to monitor what real users are trying to do, or to understand basic functionality that practically all other platforms provide. You can try emailing support@motivewave.com. Hopefully they'll respond to you that way.
BTW, I'm in 100% agreement with what you are trying to accomplish.
Been struggling with this as well, and was gonna post or email. Glad to see some folks beat me to it and I'm not alone...although I would have rather discovered a thread that shows that I just didn't know what I was doing and that this was possible already 🙈
@Shortline:
I am trying to use the "cloud study" to populate horizontal lines on my charts. My data feed is CQG and when i use EPU21 for the instrument name, the study nag screen states No matching symbol: EP. I've tried the @EPU21 and get same nag message. What am i missing?
I am using google sheets for spreadsheet, formatted like: Symbol,Price Level,Note,Foreground Color,Background Color,Diameter
Seems simple enough, publish on web, copy link into Cloud Study, but apparently i am missing a step or two. Frustrating documentation doesn't help either.
@KVK0711 everything you are saying looks correct to me. The only thing I can think of is the file format. I don't use Google sheets so I'm not familiar with it's capabilities. Are you sure the file is being saved in a *.csv format? If you open the file in a text editor such as Notepad does it look something like the below?

- Joined
- Mar 26, 2019
- Posts
- 223
- Likes
- 67
Hi,
I just tried it here and EPU21 listed as the symbol works. If you are accessing the csv file from your Google drive, try downloading it to your local drive and in the study select that as the source instead. This would test the validity of the csv file and rule out file access issues to the file on the web.
I just tried it here and EPU21 listed as the symbol works. If you are accessing the csv file from your Google drive, try downloading it to your local drive and in the study select that as the source instead. This would test the validity of the csv file and rule out file access issues to the file on the web.