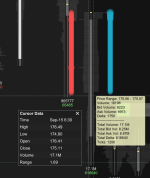
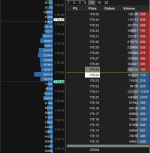
Different volume count in bar popup vs cursor data

Joined
Sep 14, 2023
Posts
12
Likes
3
Hello! Could anyone help me understand why the volume count in the pop-up of a bar, is different than the actual volume of the bar (as shown by the cursor data box). If it matters I'm using DX Feed for this data, populating historical+real-time.

Maybe if there is a trade between the spread?

1694991932903.png

Thanks!
 

Donovan2580

Well-known member
Joined
Sep 13, 2020
Posts
437
Likes
237
Everything is so zoomed in, it is kind of hard to tell what we are comparing..

The one thing I notice is the range you are comparing. The cursor data box (Left image) High is 175.12 and the Low is 174.63. It is time stamped Sept 15th at 12:45 so that is the data for that bar which appears to be a 5 or 15 minute?

The one on the right appears to only be looking at 1 tick (174.85 - 174.84)... If you hover the mouse over a footprint the yellowish box will give you the details of what occurred at that actual tick rather than the entire bar.

Hopefully that makes sense :)
 
Joined
Sep 14, 2023
Posts
12
Likes
3
Thanks for the reply!

The bar I'm hovering over, both for the popup and the cursor data box are the same. The 12:45m bar. It's a 15m bar.

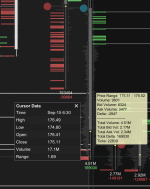
The popup (yellow) box on the right shows the values for the tick, above the "-----------" separator. Below that separator are the values for the entire bar.

I'm comparing the "Total Volume: 4.82m" in the box on the right, to the "Volume 5.75m" value on the left.
 
Joined
Sep 14, 2023
Posts
12
Likes
3
So it seems that it is a problem with loading it based on tick data - when I load it via the "Use historical minute bars" setting in the Volume Imprint settings, it calculates the correct volume (but of course incorrect bid/ask levels in the bar). I'm using DX Feed for MW, with NBBO and Level II data.. So wondering if someone knows what may be going on or if there is a way to solve for this.
(first screenshot is VI loaded from tick data, second is from historical bars)

1695009099847.png1695009118317.png
 

nooris

Well-known member
Joined
Jul 30, 2023
Posts
145
Likes
69
This might be related to another problem I noticed recently. The volume profile on the chart does not match the volume profile on the DOM. They are closely related, but always different numerically.
 
Joined
Sep 14, 2023
Posts
12
Likes
3
Hey Nooris,
I was able to resolve the issue you described (DOM and VP mismatch) - see screenshot - As long as I set both settings to use RTH data, as well as uncheck "Use historical minute bars" in the VP settings, they match. Both for /ES and Nasdaq equities.

My issue however I still can't solve. I'm wondering if it has to do with dark pool trades, or anything that doesn't hit the tick data. Not really sure. It's accurate on the /ES, but on a stock like APPL Volume calculations never match between the volume imprint and the bar.

1695054137899.png
 
Top