is there a script or study that shows the mid of the day or the full session as it is being developed throughout the session? i can't seem to find one like that. there is a mid that adjusts but it is just a straight line that is part of the OHLC study. it would be nice to see the development and where the changes occur.
You are using an out of date browser. It may not display this or other websites correctly.
You should upgrade or use an alternative browser.
You should upgrade or use an alternative browser.
day mid and full session mid
- Thread starter Tarbog
- Start date
- Joined
- Mar 26, 2019
- Posts
- 223
- Likes
- 67
Hi,
As previously mentioned, our OHLC study will show the mid of the day/session.
Would you be able to provide more details as to what specific additional functionality you are referring to when you mention "see the development and where the changes occur"?
As previously mentioned, our OHLC study will show the mid of the day/session.
Would you be able to provide more details as to what specific additional functionality you are referring to when you mention "see the development and where the changes occur"?
i was looking for a mid that developed through time. basically it would show the development of the mid from the extended hours and for the regular hours. as an example i am attaching a chart from TOS that has a full session mid as it develops shown by the orange line and a regular hours session shown by the yellow line on the chart. hopefully this makes sense.
Attachments
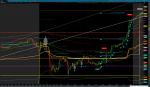
Would love to see this for the day hi/low as well. When going back to review the day, the Hi, Low, and Mid stay where they were at the day's end.
But if I went back to review 11:20 am, and price was making a new high at that time, I wouldn't actually know it was approaching the high of the day at that time based on OHLC, since the OHLC hi would be stuck at the end of day high.
Here's an example. The green dashed line is the high of the day, and you can see how it "steps up" as the high is updated, while preserving the history of what the high was previously.