clearFigures() not clear ?

Spin

Well-known member
Joined
May 22, 2019
Posts
480
Likes
192
Hello fellow MW-coders :)


Another issue is puzzling me. I am working on a Study that follows this logic:

Java:
onBarUpdate{
    calculateValues
}


calculateValues{
    clearFigures
    perform the calculations in 'Z' and draw Markers
    calculate
}

Z{
    check stuff
}

calculate{
    check signals + create secondary plots
}


I have used the general layout above before in other Studies, and had no complaints so far.

But this Study is not playing nice: if I drop it on a chart and let it run (whether on a 'live acccount' during trading hours or by making use of the 'Replay'-function), it refuses to 'clear' all figures sometimes.
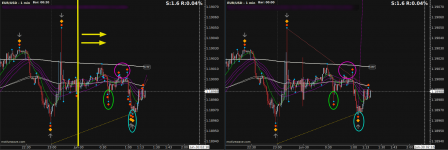
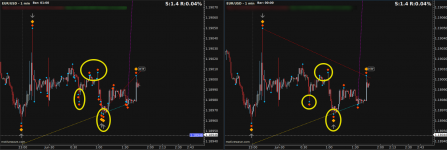
I see markers plotted above or below certain bars, and when the values of the next bar reach certain levels they should be removed onBarUpdate, and re-plotted on the current bar, but this not always happens, as you can see in the screenshot below:
1627832267954.png

FYI: I dropped the Study on the leftmost chart when it was at the yellow vertical line, and let it run on Replay. And on the chart on the right hand, I dropped that exact same Study at the current bar.

Why do some markers stay on the charts, even though I effectively erase all Figures on every 'BarUpdate' ?? :unsure:

Has anyone experienced similar behavior before ? Did you get it fixed ? How ?

Thanks for all input ! :giggle:
 

Attachments

  • dual.png
    dual.png
    119.9 KB · Views: 11
Last edited:

Dragon

Member
Joined
Aug 6, 2021
Posts
5
Likes
0
I assume you have long since solved this. But, for sport, it looks like you have some sort of re-painting that occurs. Perhaps you have member variables within the study's class which are determining the indicator's values, instead of using variables contained and managed as 'DataSeries' values. Perhaps there are some misusages of setComplete(), isBarComplete(), or addFigure(). It is hard to guess without any code. If this code structure works for you generally, but not in this indicator, then it must be an indicator-specific issue that is hard to diagnose at first glance.
 
Last edited:

Spin

Well-known member
Joined
May 22, 2019
Posts
480
Likes
192
I still have not solved this. What's more: I'm losing massive amounts of hair over this :)

I have tried several different solutions to make calculate and calculateValues play together nicely.

This is my latest and "should" work imo (code is located in calculateValues somewhere):

Java:
timeNow = series.getStartTime(i);
indexNow = series.findIndex(timeNow);
debug (formatted_time + " indexNow " + indexNow + " indexPrevMark " + indexPrevMark);

                if (indexNow < (indexPrevMark + depth)){
                    removeFigure(prevMark);
                    debug(" ######## removing " + prevMark);
                }

                if (Marker.isEnabled()){


                    points.forEach(sp -> {
                        if (finalPos == 1.0) {
                            addFigure(Plot.PRICE, mark);
                            prevMark = mark;

                            timePrevMark = prevMark.getTime();
                            indexPrevMark = series.findIndex(timePrevMark);
                             }


All this results in this:

1629739212112.png

The code says it is removing the marker located at Jun 28th 23:58:00PM and that is exactly what I want it to do.
But that blue diamond marker is still visible on the chart, so something is still off. Markers are only drawn on the latest bar, so I do not believe that 23:58:00 marker is redrawn after it has been removed.

To be sure, I added a debug-line, just below addMarker, and this is the result:

1629739517503.png

You can clearly see that the marker is added, then (on the next iteration, when I click the 'step forward' button of the Replay-controls), it is removed and the next one is printed.

I really cannot grasp why the 23:58 blue diamond is still visible after all this.


Please help :) The coding-gods will be grateful !
 

Spin

Well-known member
Joined
May 22, 2019
Posts
480
Likes
192
Solved.

When you add a figure, plot-specific:
Java:
addFigure(Plot.PRICE, mark);

You also need to remove it plot-specific:
Java:
removeFigure(Plot.PRICE,prevMark);

because removing it 'non-plot-specific'
Java:
removeFigure(prevMark);
will not work, nor output an error ("marker does not exist"). Everything will look fine and act as if it works, but it will not.

In the SDK API overview, a hint can be found:
1630470056721.png

I sort of did not realize yet there are several 'figure lists', one for each plot. An error stating that the specific figure I want to remove is not included in the list I am trying to remove it from would have been nice (**hint hint**, MW-dev-crew ;))

Another couple of hours of my life I will never get back :ROFLMAO:
 
Last edited:
Top