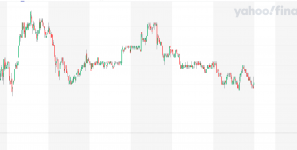
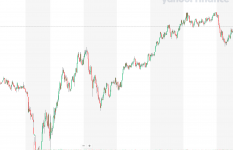
Hello, my motivewave candles suddenly started looking a bit more strange than usual. The wicks of the candles seem to align with each other perfectly a lot more on the timeframes 5mins and lower. I know they used to not always look this way so I don't know if I accidentally changed some setting. I'm a little newer to trading too so I'm not sure if it's specific to the stock I'm looking at and if it's just low volume or something but it definitely doesn't look right to me.

EDIT: Alright so thanks to some online help I figured out that it's because tradestation isn't giving me the available data for the smaller timeframes for some reason and it's just taking the data from larger timeframes. Although I don't know why tradestation isn't giving me more recent data for BBBY. I checked AAPL and it seemed fine. at the least, right-clicking on the chart and clicking "refresh local data" fixed the historical data but the recent data still isn't fixed.

EDIT: Alright so thanks to some online help I figured out that it's because tradestation isn't giving me the available data for the smaller timeframes for some reason and it's just taking the data from larger timeframes. Although I don't know why tradestation isn't giving me more recent data for BBBY. I checked AAPL and it seemed fine. at the least, right-clicking on the chart and clicking "refresh local data" fixed the historical data but the recent data still isn't fixed.
Last edited:


