ScottyA
Well-known member
- Joined
- Aug 1, 2019
- Posts
- 272
- Likes
- 183
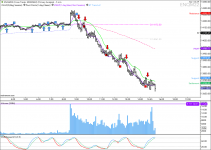
I want to share a cool, trend-following Study that I had developed a while ago. It's time that I dusted it off... (I may have a Strategy to accompany this. Will need to check).
BT was the nickname of a great trend-trader I used to work with. His secret sauce was the foundation of this Study. Entries and Exits are based on the position of price relative to the faster HMA and slower KAMA moving averages, plus in relation to being above or below VWAP.
Study Logic
Long Entries are calculated by the first bullish bar to close above VWAP and the KAMA, while the HMA and KAMA are increasing.
Short Entries are calculated by the first bearish bar to close below VWAP and the KAMA, while the HMA and KAMA are decreasing.
Long Exits are calculated by a close below VWAP, a close below the KAMA, or after three consecutive Bearish bars.
Short Exits are calculated by a close above VWAP, a close above the KAMA or after three consecutive Bullish bars.
I was never fully satisfied with the Entry/Exit logic because I wanted something that worked perfectly in all markets and not just trending markets. The most success I had backtesting was with NQ on 20-range bars, but that was a few years ago, pre-pandemic and when NQ was priced in the 7k to 8k. No telling what Range bars would work today.
If anyone is interested in fiddling with the logic more, let me know. Perhaps we may come up with something as a community!

