Anyone know a way to display the most recent high or low??

Donovan2580

Well-known member
Joined
Sep 13, 2020
Posts
442
Likes
239
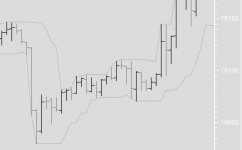
I just switched from trading ES to NQ and the increase in speed is tripping me up a bit. I keep getting in trades and then realize my stop is going to have to be a lot bigger than I had thought "on the fly". It would be really nice to see an actual live updated number on the screen of the high and low of the last 5 minutes or so...

Does anyone know of an indicator that will just show this?? Pivot points, support and resistance don't really work because they are delayed and not always at the exact level.

Any programmers out there that are tinkering with MW that would like to do the easiest (Hopefully) study ever?? :) 🙏

I am just looking for something like this... High and low of last XXX minutes or seconds. Thank you!

Capture.PNG
 
Last edited:

igor.s

Well-known member
Joined
May 22, 2019
Posts
289
Likes
153
Donovan,

Until you have a custom study developed to support your idea, you can use the existing MA High Low study. For example, an attached chart shows how the study tracks 6 bars hi/lo. You can adjust the lines color/width to make it less distracting but still giving you the last N of bars range.
Just a thought.

cheers.
 

Attachments

  • Screenshot 2024-03-02 at 8.14.26 AM.png
    Screenshot 2024-03-02 at 8.14.26 AM.png
    29.4 KB · Views: 12
  • Screenshot 2024-03-02 at 8.14.51 AM.png
    Screenshot 2024-03-02 at 8.14.51 AM.png
    28.3 KB · Views: 12

Donovan2580

Well-known member
Joined
Sep 13, 2020
Posts
442
Likes
239
Donovan,

Until you have a custom study developed to support your idea, you can use the existing MA High Low study. For example, an attached chart shows how the study tracks 6 bars hi/lo. You can adjust the lines color/width to make it less distracting but still giving you the last N of bars range.
Just a thought.

cheers.

Oh man thank you @igor.s !! I was hoping there was already some study in there I was not aware of...

I can 100% tweak this to do exactly what I need!!

The second option below is almost identical to my "wish" on the original post.

Thanks a million for this - You saved me a ton of time and hassle!!! 🙏


Option 1

Turn off the bands & just put the recent high or low on the price axis:

1709472272522.png


Option 2

Hide the bands by making them totally transparent and use the tag function to display the prices.

1709472588841.png
 
Last edited:

igor.s

Well-known member
Joined
May 22, 2019
Posts
289
Likes
153
Oh man thank you @igor.s !! I was hoping there was already some study in there I was not aware of...

I can 100% tweak this to do exactly what I need!!

The second option below is almost identical to my "wish" on the original post.

Thanks a million for this - You saved me a ton of time and hassle!!! 🙏


Option 1

Hide all the lines and just put the recent high or low on the price axis:

View attachment 2236


Option 2

Hide the bands by making them totally transparent and use the tag function to display the prices.

View attachment 2237
great options!
 

concierlo

New member
Joined
Apr 28, 2024
Posts
1
Likes
0
Hi everybody! (newbie here)
Along the lines of this one - is there a setting to show the High and Low of the current bar in the price axis?

In other words, while a bar is drawing, the high gets set and a label stays in place on the Axis indicating the High of that bar - it would update the label if it goes higher while its drawing. (Vice versa for the low of the bar)

This EMA study was close but it only outlines previously written bars and not the "in progress" bar....

Thanks!!
 
Top