You are using an out of date browser. It may not display this or other websites correctly.
You should upgrade or use an alternative browser.
You should upgrade or use an alternative browser.
how to get drawings on all grouped charts with different study on each chart
- Thread starter barker
- Start date
I recently asked support about this, will see what the response is. I don't think you are doing anything wrong with analysis - they seem to have been designed this way for some reason. This question has been asked many times before, I haven't seen a good answer.
barker
Well-known member
- Joined
- Sep 23, 2023
- Posts
- 59
- Likes
- 8
am also waiting on response from support. not sure what the reason would be to create additional charts in analysis beyond a specific time Frame forward grid "Daily, Hourly, 1m" but I don't exactly use studies on these beyond a composite.
So the response was to use the same analysis for all charts that are supposed to share drawings and use the visibility setting on studies to control on which timeframes these studies show up. Makes sense. I am now setting up my charts to see if there are any rough edges to iron out with this approach.
barker
Well-known member
- Joined
- Sep 23, 2023
- Posts
- 59
- Likes
- 8
I received a similar email. Did it work?So the response was to use the same analysis for all charts that are supposed to share drawings and use the visibility setting on studies to control on which timeframes these studies show up. Makes sense. I am now setting up my charts to see if there are any rough edges to iron out with this approach.
barker
Well-known member
- Joined
- Sep 23, 2023
- Posts
- 59
- Likes
- 8
I don't think there is a way to simply plot drawings on grouped chart sets of the same ticker using different study on each chart. I have to stop trying this is driving me insane. will resort to charting composite too on a single chart in mw and I guess chart everything else with tos.
I tried the visibility but it changes visibility even across group. bleh
I tried the visibility but it changes visibility even across group. bleh
barker
Well-known member
- Joined
- Sep 23, 2023
- Posts
- 59
- Likes
- 8
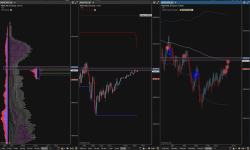
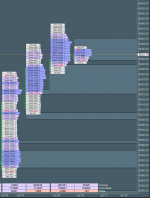
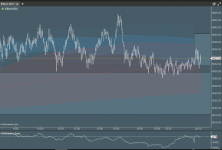
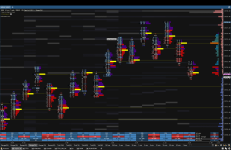
I mostly succeeded at this. Mostly being it all works except for what I believe to be a bug. See attached screenshots for reference - same drawings, different studies, sometimes shared (like VWAP bands).I don't think there is a way to simply plot drawings on grouped chart sets of the same ticker using different study on each chart. I have to stop trying this is driving me insane. will resort to charting composite too on a single chart in mw and I guess chart everything else with tos.
I tried the visibility but it changes visibility even across group. bleh
The potential bug is a very weird behavior, where adding more than 2 Volume Imprint studies to the analysis results in one of the existing studies to be deleted. It's really weird. Sometimes I will manage to get 3 VIs, other times just one. It genuienly seems to be some programmatic issue with how Analysis stores studies when multiple charts are open. At one time one VI study was deleted simply because I added a new chart, that had a VWAP study on it.
I would be *very* careful with this. In my experience it completely mangles volume data. The only problem it tries to solve is data loading speed, but the price is very high. I would much rather rely on number of bars / days for tick chart settings to limit how much data can be loaded.using the historical minute bar
A few weeks ago I discovered another issue, which may be causing you some frustration unknowingly. Sometimes when you make a change to your workspace, some studies will stop showing. The study is still there, just not showing any graphs. I experienced another variant of this issue while using Rithmic. Sometimes the connection would be lost. After reconnecting, the missing data would be downloaded, which was clearly visible on bar charts, but studies relying on volume would not update. Forcing to update them required either changing the bar size or modifying something about the study. I developed a workaround process of changing bar sizes by 1 up then 1 down. I don't think this workaround is going to work in this new approach, that relies so heavily on the visibility setting, so now I am going with changing the tick size on my volume imprints by 1 up then 1 down. That "refreshes" the study, forcing it to redraw itself correctly. I access these invisible studies by using the Object Viewer (Option + V on a mac, probably Alt + V on Windows / Linux). Try it out - maybe your composite was there the whole time, just hidden... Support reproduced this issue and classified it as a bug already, so hopefully it will be fixed soon.
Attachments
Last edited:
barker
Well-known member
- Joined
- Sep 23, 2023
- Posts
- 59
- Likes
- 8
You're right about the historical bar data but it seemed like it helped with the top study.I mostly succeeded at this. Mostly being it all works except for what I believe to be a bug. See attached screenshots for reference - same drawings, different studies, sometimes shared (like VWAP bands).
The potential bug is a very weird behavior, where adding more than 2 Volume Imprint studies to the analysis results in one of the existing studies to be deleted. It's really weird. Sometimes I will manage to get 3 VIs, other times just one. It genuienly seems to be some programmatic issue with how Analysis stores studies when multiple charts are open. At one time one VI study was deleted simply because I added a new chart, that had a VWAP study on it.
I would be *very* careful with this. In my experience it completely mangles volume data. The only problem it tries to solve is data loading speed, but the price is very high. I would much rather rely on number of bars / days for tick chart settings to limit how much data can be loaded.
A few weeks ago I discovered another issue, which may be causing you some frustration unknowingly. Sometimes when you make a change to your workspace, some studies will stop showing. The study is still there, just not showing any graphs. I experienced another variant of this issue while using Rithmic. Sometimes the connection would be lost. After reconnecting, the missing data would be downloaded, which was clearly visible on bar charts, but studies relying on volume would not update. Forcing to update them required either changing the bar size or modifying something about the study. I developed a workaround process of changing bar sizes by 1 up then 1 down. I don't think this workaround is going to work in this new approach, that relies so heavily on the visibility setting, so now I am going with changing the tick size on my volume imprints by 1 up then 1 down. That "refreshes" the study, forcing it to redraw itself correctly. I access these invisible studies by using the Object Viewer (Option + V on a mac, probably Alt + V on Windows / Linux). Try it out - maybe your composite was there the whole time, just hidden... Support reproduced this issue and classified it as a bug already, so hopefully it will be fixed soon.
barker
Well-known member
- Joined
- Sep 23, 2023
- Posts
- 59
- Likes
- 8
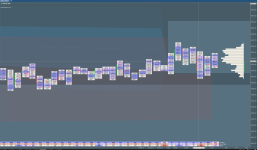
this is kind of a bummer since one of my fav imprints requires 2x imprint. was about to create another page/grid with this.I mostly succeeded at this. Mostly being it all works except for what I believe to be a bug. See attached screenshots for reference - same drawings, different studies, sometimes shared (like VWAP bands).
The potential bug is a very weird behavior, where adding more than 2 Volume Imprint studies to the analysis results in one of the existing studies to be deleted. It's really weird. Sometimes I will manage to get 3 VIs, other times just one. It genuienly seems to be some programmatic issue with how Analysis stores studies when multiple charts are open. At one time one VI study was deleted simply because I added a new chart, that had a VWAP study on it.
Attachments
I don't think it's an intentional limit. It really looks like a bug, where adding a new study sometimes erases a prior one. What makes me think it's a bug is how unpredictable it is.this is kind of a bummer since one of my fav imprints requires 2x imprint. was about to create another page/grid with this.
Russell8301
New member
- Joined
- Jan 28, 2025
- Posts
- 4
- Likes
- 0
I was disappointed to find this thread as I created a new one basically trying to do the same thing. Have support/resistance levels show up on all my charts. I have not been able to do it. I am still not clear if somehow using historical minute bars makes it possible, or how to do that.
Oltreoceano
Member
- Joined
- Jul 5, 2019
- Posts
- 5
- Likes
- 3
Look up this thread https://support.motivewave.com/forum/index.php?threads/drawing-tools-linking.165/
Also you can check this video
Also you can check this video